|
Download Data (XLS File) |
|
||||||||
|
||||||||
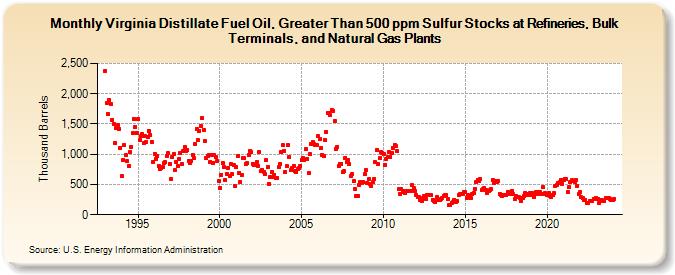
| Virginia Distillate Fuel Oil, Greater Than 500 ppm Sulfur Stocks at Refineries, Bulk Terminals, and Natural Gas Plants (Thousand Barrels) | ||||||||
| Year | Jan | Feb | Mar | Apr | May | Jun | Jul | Aug | Sep | Oct | Nov | Dec |
|---|---|---|---|---|---|---|---|---|---|---|---|---|
| 1993 | 2,376 | 1,844 | 1,664 | 1,895 | 1,833 | 1,566 | 1,502 | 1,185 | 1,440 | 1,487 | 1,425 | 1,110 |
| 1994 | 642 | 908 | 1,150 | 980 | 887 | 803 | 1,042 | 1,127 | 1,348 | 1,590 | 1,455 | 1,355 |
| 1995 | 1,585 | 1,227 | 1,300 | 1,331 | 1,187 | 1,293 | 1,195 | 1,284 | 1,390 | 1,320 | 1,206 | 879 |
| 1996 | 1,005 | 922 | 970 | 810 | 756 | 770 | 782 | 859 | 867 | 978 | 1,012 | 841 |
| 1997 | 595 | 955 | 1,004 | 734 | 875 | 802 | 924 | 1,018 | 834 | 1,047 | 1,119 | 1,045 |
| 1998 | 1,076 | 893 | 863 | 892 | 994 | 934 | 1,168 | 1,423 | 1,230 | 1,388 | 1,464 | 1,597 |
| 1999 | 1,404 | 1,211 | 937 | 971 | 994 | 872 | 986 | 862 | 985 | 956 | 896 | 555 |
| 2000 | 439 | 657 | 853 | 787 | 568 | 675 | 775 | 640 | 836 | 668 | 817 | 469 |
| 2001 | 787 | 968 | 691 | 537 | 659 | 930 | 930 | 833 | 848 | 988 | 1,061 | 1,040 |
| 2002 | 844 | 830 | 815 | 870 | 813 | 1,034 | 720 | 743 | 708 | 673 | 907 | 790 |
| 2003 | 510 | 618 | 707 | 622 | 661 | 612 | 615 | 784 | 845 | 1,031 | 1,147 | 1,047 |
| 2004 | 708 | 805 | 1,145 | 954 | 735 | 779 | 811 | 722 | 702 | 759 | 780 | 813 |
| 2005 | 906 | 937 | 909 | 1,082 | 923 | 686 | 999 | 1,167 | 1,202 | 1,170 | 1,147 | 1,155 |
| 2006 | 1,294 | 1,245 | 1,101 | 988 | 963 | 1,241 | 1,371 | 1,686 | 1,680 | 1,644 | 1,731 | 1,722 |
| 2007 | 1,548 | 1,083 | 1,124 | 802 | 844 | 842 | 702 | 717 | 942 | 870 | 910 | 833 |
| 2008 | 639 | 666 | 550 | 433 | 317 | 315 | 491 | 548 | 520 | 541 | 668 | 731 |
| 2009 | 528 | 583 | 510 | 477 | 534 | 594 | 864 | 1,069 | 840 | 931 | 1,038 | 1,022 |
| 2010 | 997 | 826 | 920 | 950 | 1,043 | 961 | 1,015 | 1,096 | 1,153 | 1,131 | 1,047 | 419 |
| 2011 | 350 | 421 | 372 | 390 | 354 | 390 | 392 | 398 | 388 | 494 | 437 | 394 |
| 2012 | 318 | 288 | 286 | 250 | 234 | 270 | 304 | 268 | 334 | 324 | 324 | 321 |
| 2013 | 249 | 233 | 208 | 285 | 246 | 238 | 259 | 278 | 306 | 323 | 323 | 262 |
| 2014 | 158 | 163 | 196 | 215 | 246 | 202 | 223 | 323 | 336 | 346 | 342 | 379 |
| 2015 | 371 | 278 | 318 | 309 | 280 | 349 | 361 | 423 | 541 | 578 | 554 | 593 |
| 2016 | 409 | 418 | 441 | 416 | 364 | 392 | 402 | 422 | 579 | 528 | 551 | 543 |
| 2017 | 561 | 343 | 329 | 317 | 330 | 329 | 326 | 380 | 373 | 338 | 394 | 337 |
| 2018 | 254 | 317 | 295 | 285 | 284 | 233 | 270 | 311 | 364 | 329 | 343 | 356 |
| 2019 | 329 | 362 | 301 | 346 | 376 | 346 | 371 | 377 | 336 | 451 | 353 | 341 |
| 2020 | 323 | 357 | 308 | 297 | 327 | 352 | 482 | 498 | 519 | 543 | 581 | 512 |
| 2021 | 579 | 589 | 586 | 369 | 455 | 535 | 568 | 556 | 548 | 576 | 482 | 343 |
| 2022 | 377 | 287 | 274 | 235 | 240 | 195 | 199 | 231 | 219 | 234 | 268 | 259 |
| 2023 | 280 | 266 | 195 | 242 | 242 | 232 | 234 | 274 | 280 | 281 | 268 | 235 |
| 2024 | 250 | |||||||||||
| - = No Data Reported; -- = Not Applicable; NA = Not Available; W = Withheld to avoid disclosure of individual company data. |
| Release Date: 3/29/2024 |
| Next Release Date: 4/30/2024 |