|
Download Data (XLS File) |
|
||||||||
|
||||||||
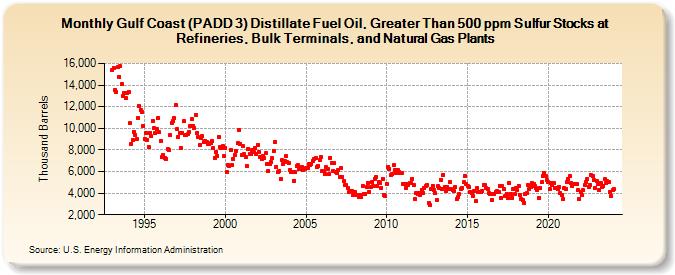
| Gulf Coast (PADD 3) Distillate Fuel Oil, Greater Than 500 ppm Sulfur Stocks at Refineries, Bulk Terminals, and Natural Gas Plants (Thousand Barrels) | ||||||||
| Year | Jan | Feb | Mar | Apr | May | Jun | Jul | Aug | Sep | Oct | Nov | Dec |
|---|---|---|---|---|---|---|---|---|---|---|---|---|
| 1993 | 15,355 | 15,622 | 13,575 | 13,335 | 15,641 | 14,775 | 15,736 | 14,100 | 13,008 | 13,303 | 12,770 | 13,234 |
| 1994 | 13,386 | 10,448 | 8,565 | 8,932 | 9,677 | 9,404 | 8,976 | 10,959 | 12,044 | 11,672 | 11,545 | 10,246 |
| 1995 | 9,050 | 9,598 | 8,948 | 8,314 | 9,594 | 9,243 | 10,712 | 10,002 | 9,531 | 9,895 | 10,962 | 9,627 |
| 1996 | 8,841 | 7,360 | 7,529 | 7,277 | 7,189 | 8,096 | 7,962 | 9,360 | 10,521 | 10,710 | 10,952 | 12,174 |
| 1997 | 9,902 | 9,229 | 9,606 | 8,178 | 9,568 | 10,644 | 9,358 | 9,383 | 9,426 | 9,650 | 10,232 | 10,853 |
| 1998 | 10,252 | 10,031 | 11,256 | 9,576 | 9,174 | 8,485 | 9,091 | 9,241 | 8,735 | 8,806 | 8,717 | 8,549 |
| 1999 | 8,520 | 8,640 | 8,808 | 8,172 | 7,287 | 7,779 | 7,458 | 9,177 | 8,271 | 8,202 | 8,336 | 7,457 |
| 2000 | 8,191 | 5,946 | 6,571 | 6,476 | 7,960 | 6,594 | 7,178 | 7,542 | 7,927 | 8,594 | 9,855 | 8,557 |
| 2001 | 7,506 | 8,335 | 7,587 | 7,367 | 6,511 | 8,109 | 7,642 | 7,587 | 7,987 | 7,770 | 8,204 | 7,666 |
| 2002 | 8,482 | 7,844 | 7,372 | 7,112 | 7,429 | 7,268 | 7,710 | 6,698 | 6,038 | 6,674 | 6,861 | 7,221 |
| 2003 | 7,943 | 8,720 | 6,460 | 5,918 | 6,054 | 5,291 | 7,022 | 6,722 | 7,011 | 7,424 | 6,876 | 6,823 |
| 2004 | 6,177 | 5,919 | 5,985 | 5,159 | 5,918 | 6,465 | 6,575 | 6,211 | 6,288 | 6,400 | 6,100 | 6,225 |
| 2005 | 6,295 | 6,330 | 6,683 | 6,573 | 6,737 | 7,015 | 7,189 | 7,237 | 6,381 | 6,551 | 7,032 | 7,311 |
| 2006 | 6,078 | 6,040 | 5,754 | 6,380 | 6,223 | 5,739 | 7,279 | 6,833 | 6,058 | 6,758 | 5,956 | 5,903 |
| 2007 | 6,128 | 5,523 | 6,304 | 5,494 | 5,092 | 4,786 | 4,745 | 4,449 | 4,057 | 4,184 | 4,158 | 3,853 |
| 2008 | 4,081 | 3,857 | 3,813 | 3,632 | 3,836 | 3,665 | 4,679 | 3,954 | 3,948 | 4,533 | 4,975 | 4,149 |
| 2009 | 4,602 | 5,024 | 4,677 | 5,337 | 5,518 | 4,626 | 4,999 | 4,925 | 4,492 | 5,340 | 3,852 | 3,720 |
| 2010 | 4,859 | 6,420 | 6,249 | 5,646 | 5,730 | 6,567 | 6,102 | 5,874 | 6,184 | 5,916 | 5,904 | 5,845 |
| 2011 | 4,881 | 4,857 | 4,501 | 4,861 | 4,761 | 4,893 | 4,947 | 5,351 | 4,709 | 3,437 | 3,979 | 3,940 |
| 2012 | 4,032 | 3,856 | 4,283 | 4,035 | 4,493 | 4,615 | 4,770 | 3,122 | 2,926 | 4,390 | 4,687 | 4,333 |
| 2013 | 3,976 | 3,380 | 4,630 | 4,454 | 5,214 | 4,339 | 5,678 | 4,554 | 4,176 | 4,590 | 4,409 | 5,013 |
| 2014 | 4,397 | 4,262 | 4,176 | 4,523 | 3,427 | 3,634 | 3,891 | 4,363 | 4,497 | 4,993 | 5,613 | 4,867 |
| 2015 | 4,691 | 4,547 | 4,143 | 3,978 | 3,714 | 4,174 | 3,249 | 4,468 | 4,098 | 4,136 | 4,067 | 4,227 |
| 2016 | 4,787 | 4,742 | 4,456 | 4,401 | 3,987 | 3,883 | 3,388 | 3,888 | 3,953 | 4,149 | 4,157 | 4,076 |
| 2017 | 4,675 | 3,551 | 4,623 | 4,358 | 3,724 | 3,920 | 3,567 | 4,934 | 3,941 | 3,576 | 4,346 | 3,916 |
| 2018 | 4,508 | 4,327 | 4,673 | 3,854 | 3,492 | 3,376 | 3,124 | 3,920 | 3,981 | 4,763 | 4,380 | 4,564 |
| 2019 | 4,908 | 4,842 | 4,666 | 4,480 | 4,290 | 3,510 | 4,429 | 4,985 | 5,618 | 5,844 | 5,589 | 5,173 |
| 2020 | 5,049 | 4,335 | 4,901 | 4,711 | 4,926 | 4,506 | 4,510 | 4,388 | 4,592 | 3,969 | 3,861 | 3,426 |
| 2021 | 4,466 | 4,386 | 5,018 | 5,331 | 5,580 | 4,922 | 4,650 | 4,855 | 4,872 | 4,839 | 4,287 | 3,488 |
| 2022 | 4,065 | 3,799 | 4,256 | 4,748 | 5,029 | 5,307 | 4,575 | 4,763 | 5,664 | 5,582 | 5,191 | 4,497 |
| 2023 | 5,078 | 4,819 | 4,332 | 4,981 | 4,595 | 4,684 | 5,281 | 4,920 | 5,116 | 4,983 | 4,120 | 3,710 |
| 2024 | 4,287 | |||||||||||
| - = No Data Reported; -- = Not Applicable; NA = Not Available; W = Withheld to avoid disclosure of individual company data. |
| Release Date: 3/29/2024 |
| Next Release Date: 4/30/2024 |