|
Download Data (XLS File) |
|
||||||||
|
||||||||
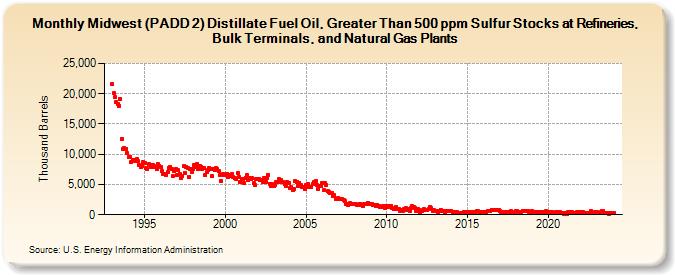
| Midwest (PADD 2) Distillate Fuel Oil, Greater Than 500 ppm Sulfur Stocks at Refineries, Bulk Terminals, and Natural Gas Plants (Thousand Barrels) | ||||||||
| Year | Jan | Feb | Mar | Apr | May | Jun | Jul | Aug | Sep | Oct | Nov | Dec |
|---|---|---|---|---|---|---|---|---|---|---|---|---|
| 1993 | 21,556 | 20,072 | 19,450 | 18,713 | 18,233 | 17,978 | 19,095 | 12,598 | 10,915 | 10,962 | 10,945 | 10,146 |
| 1994 | 9,563 | 9,594 | 8,659 | 9,101 | 8,997 | 8,826 | 9,167 | 8,808 | 8,202 | 7,923 | 8,063 | 8,763 |
| 1995 | 8,563 | 7,770 | 7,494 | 8,322 | 8,196 | 7,832 | 8,280 | 7,973 | 7,969 | 7,516 | 8,314 | 8,094 |
| 1996 | 7,966 | 7,164 | 6,780 | 6,710 | 6,600 | 7,127 | 7,772 | 7,915 | 7,508 | 6,330 | 7,277 | 7,511 |
| 1997 | 6,497 | 7,364 | 6,798 | 6,010 | 6,467 | 8,010 | 6,937 | 7,921 | 7,753 | 6,311 | 7,502 | 7,113 |
| 1998 | 7,558 | 8,212 | 7,838 | 8,325 | 7,556 | 8,051 | 7,966 | 7,588 | 7,783 | 6,493 | 7,008 | 7,394 |
| 1999 | 7,753 | 7,514 | 6,345 | 7,576 | 7,389 | 7,713 | 7,559 | 7,155 | 6,577 | 5,526 | 6,683 | 6,614 |
| 2000 | 6,621 | 6,789 | 6,242 | 6,614 | 6,415 | 6,701 | 6,227 | 6,020 | 5,894 | 6,851 | 6,294 | 5,366 |
| 2001 | 5,978 | 5,874 | 5,205 | 6,126 | 6,499 | 5,663 | 6,100 | 5,867 | 6,020 | 5,225 | 4,948 | 5,929 |
| 2002 | 5,902 | 5,889 | 5,700 | 5,743 | 5,456 | 6,063 | 5,440 | 6,104 | 6,569 | 5,157 | 4,718 | 5,001 |
| 2003 | 4,787 | 4,964 | 5,388 | 5,394 | 5,830 | 5,795 | 5,345 | 5,335 | 4,998 | 4,703 | 5,359 | 5,316 |
| 2004 | 4,477 | 4,510 | 4,125 | 4,301 | 5,541 | 5,490 | 4,768 | 5,321 | 4,850 | 4,530 | 4,603 | 4,233 |
| 2005 | 4,951 | 5,076 | 4,647 | 4,660 | 4,640 | 5,013 | 5,438 | 5,532 | 4,902 | 4,243 | 4,718 | 4,685 |
| 2006 | 5,322 | 4,081 | 5,164 | 4,923 | 3,847 | 3,751 | 3,604 | 3,586 | 3,110 | 3,205 | 2,676 | 2,572 |
| 2007 | 2,722 | 2,577 | 2,557 | 2,524 | 2,499 | 2,238 | 1,803 | 1,637 | 1,784 | 1,859 | 1,726 | 1,792 |
| 2008 | 1,760 | 1,780 | 1,542 | 1,582 | 1,701 | 1,628 | 1,472 | 1,762 | 1,737 | 1,810 | 1,904 | 1,797 |
| 2009 | 1,706 | 1,795 | 1,532 | 1,619 | 1,405 | 1,630 | 1,397 | 1,354 | 1,295 | 1,383 | 1,434 | 1,118 |
| 2010 | 1,410 | 1,280 | 1,456 | 1,503 | 1,129 | 928 | 944 | 1,225 | 886 | 946 | 577 | 701 |
| 2011 | 672 | 1,010 | 1,028 | 861 | 999 | 686 | 1,034 | 1,365 | 1,234 | 1,177 | 686 | 908 |
| 2012 | 799 | 514 | 695 | 716 | 891 | 788 | 731 | 970 | 1,326 | 1,121 | 660 | 729 |
| 2013 | 544 | 598 | 518 | 594 | 834 | 567 | 650 | 528 | 550 | 690 | 661 | 608 |
| 2014 | 576 | 488 | 498 | 376 | 484 | 253 | 309 | 260 | 287 | 428 | 507 | 412 |
| 2015 | 463 | 336 | 414 | 433 | 522 | 432 | 475 | 620 | 533 | 381 | 318 | 370 |
| 2016 | 474 | 357 | 451 | 632 | 610 | 620 | 811 | 829 | 814 | 722 | 761 | 781 |
| 2017 | 629 | 515 | 386 | 329 | 370 | 342 | 471 | 439 | 559 | 389 | 354 | 338 |
| 2018 | 537 | 572 | 452 | 412 | 519 | 621 | 541 | 567 | 565 | 610 | 456 | 322 |
| 2019 | 606 | 428 | 465 | 485 | 469 | 373 | 370 | 439 | 417 | 427 | 562 | 497 |
| 2020 | 420 | 435 | 382 | 402 | 365 | 319 | 385 | 519 | 414 | 388 | 321 | 282 |
| 2021 | 172 | 364 | 192 | 448 | 455 | 453 | 452 | 276 | 309 | 395 | 390 | 348 |
| 2022 | 395 | 319 | 420 | 246 | 275 | 243 | 331 | 237 | 612 | 241 | 312 | 394 |
| 2023 | 415 | 313 | 278 | 434 | 536 | 536 | 355 | 304 | 285 | 176 | 270 | 292 |
| 2024 | 325 | |||||||||||
| - = No Data Reported; -- = Not Applicable; NA = Not Available; W = Withheld to avoid disclosure of individual company data. |
| Release Date: 3/29/2024 |
| Next Release Date: 4/30/2024 |