|
Download Data (XLS File) |
|
||||||||
|
||||||||
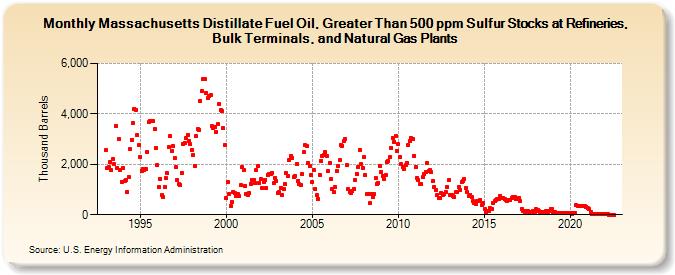
| Massachusetts Distillate Fuel Oil, Greater Than 500 ppm Sulfur Stocks at Refineries, Bulk Terminals, and Natural Gas Plants (Thousand Barrels) | ||||||||
| Year | Jan | Feb | Mar | Apr | May | Jun | Jul | Aug | Sep | Oct | Nov | Dec |
|---|---|---|---|---|---|---|---|---|---|---|---|---|
| 1993 | 2,549 | 1,848 | 1,874 | 2,077 | 1,755 | 2,191 | 2,001 | 3,513 | 1,869 | 2,988 | 1,786 | 1,313 |
| 1994 | 1,834 | 1,318 | 1,370 | 908 | 1,505 | 2,597 | 2,977 | 3,654 | 4,206 | 4,171 | 3,149 | 2,754 |
| 1995 | 2,290 | 1,752 | 1,815 | 1,793 | 1,817 | 2,505 | 3,662 | 3,734 | 3,728 | 3,701 | 3,401 | 2,651 |
| 1996 | 1,970 | 1,081 | 1,436 | 768 | 701 | 1,108 | 1,442 | 1,639 | 2,673 | 3,108 | 2,540 | 2,736 |
| 1997 | 2,253 | 1,877 | 1,373 | 1,208 | 1,181 | 1,669 | 2,816 | 2,861 | 3,040 | 3,170 | 2,906 | 2,789 |
| 1998 | 2,587 | 2,371 | 1,926 | 3,132 | 3,381 | 3,375 | 4,527 | 4,906 | 5,390 | 5,379 | 4,834 | 4,616 |
| 1999 | 4,698 | 4,732 | 3,503 | 3,448 | 3,486 | 3,286 | 3,582 | 4,405 | 4,153 | 4,107 | 3,433 | 2,772 |
| 2000 | 647 | 1,279 | 827 | 342 | 514 | 908 | 842 | 760 | 820 | 733 | 1,176 | 1,874 |
| 2001 | 1,767 | 1,138 | 829 | 778 | 854 | 1,233 | 1,377 | 1,381 | 1,258 | 1,768 | 1,915 | 1,266 |
| 2002 | 1,413 | 1,055 | 1,296 | 1,380 | 1,073 | 1,583 | 1,619 | 1,624 | 1,665 | 1,250 | 1,468 | 1,347 |
| 2003 | 864 | 888 | 1,077 | 778 | 1,020 | 1,204 | 1,641 | 1,526 | 2,189 | 2,343 | 2,254 | 1,490 |
| 2004 | 1,546 | 2,017 | 1,349 | 1,219 | 1,164 | 1,608 | 2,478 | 2,750 | 2,719 | 2,052 | 1,936 | 1,566 |
| 2005 | 1,282 | 1,755 | 1,028 | 768 | 634 | 1,594 | 2,148 | 2,332 | 2,376 | 2,479 | 2,328 | 1,725 |
| 2006 | 2,066 | 1,420 | 1,002 | 907 | 1,085 | 1,750 | 1,940 | 2,154 | 2,765 | 2,741 | 2,916 | 3,004 |
| 2007 | 1,973 | 1,006 | 892 | 877 | 929 | 1,021 | 1,370 | 1,635 | 1,907 | 2,580 | 2,003 | 1,866 |
| 2008 | 2,272 | 1,569 | 808 | 803 | 451 | 810 | 712 | 818 | 1,460 | 1,233 | 1,268 | 1,952 |
| 2009 | 1,686 | 1,536 | 1,420 | 1,556 | 2,098 | 2,131 | 2,270 | 2,663 | 3,045 | 2,900 | 3,119 | 2,547 |
| 2010 | 2,803 | 2,291 | 1,994 | 1,892 | 1,822 | 1,966 | 2,058 | 2,752 | 2,915 | 3,040 | 2,994 | 2,339 |
| 2011 | 1,893 | 1,474 | 1,361 | 1,212 | 1,202 | 1,496 | 1,610 | 1,701 | 2,042 | 1,716 | 1,775 | 1,681 |
| 2012 | 1,323 | 1,099 | 998 | 781 | 668 | 669 | 867 | 769 | 814 | 895 | 1,101 | 1,359 |
| 2013 | 788 | 782 | 741 | 722 | 891 | 893 | 1,086 | 1,000 | 1,296 | 1,321 | 1,421 | 1,053 |
| 2014 | 887 | 723 | 775 | 683 | 533 | 475 | 437 | 544 | 540 | 594 | 377 | 449 |
| 2015 | 230 | 82 | 132 | 133 | 265 | 246 | 474 | 537 | 597 | 606 | 631 | 761 |
| 2016 | 681 | 662 | 621 | 578 | 542 | 586 | 594 | 678 | 705 | 712 | 615 | 629 |
| 2017 | 680 | 534 | 229 | 165 | 127 | 161 | 140 | 119 | 108 | 124 | 138 | 124 |
| 2018 | 220 | 176 | 128 | 111 | 95 | 86 | 123 | 135 | 125 | 132 | 243 | 245 |
| 2019 | 83 | 96 | 52 | 70 | 57 | 53 | 50 | 58 | 69 | 59 | 75 | 63 |
| 2020 | 54 | 45 | 72 | 59 | 370 | 364 | 360 | 357 | 342 | 341 | 338 | 322 |
| 2021 | 253 | 219 | 117 | 46 | 40 | 37 | 35 | 34 | 29 | 25 | 18 | 16 |
| 2022 | 16 | 16 | 16 | 4 | 2 | 2 | 1 | |||||
| - = No Data Reported; -- = Not Applicable; NA = Not Available; W = Withheld to avoid disclosure of individual company data. |
| Release Date: 3/29/2024 |
| Next Release Date: 4/30/2024 |