|
Download Data (XLS File) |
|
||||||||
|
||||||||
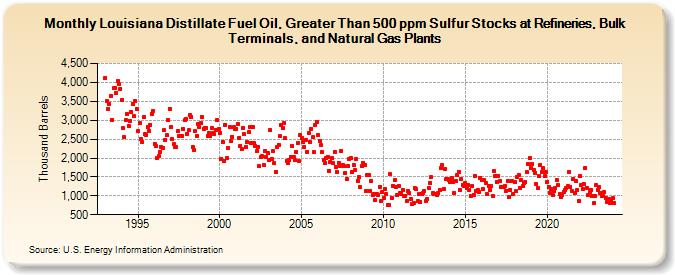
| Louisiana Distillate Fuel Oil, Greater Than 500 ppm Sulfur Stocks at Refineries, Bulk Terminals, and Natural Gas Plants (Thousand Barrels) | ||||||||
| Year | Jan | Feb | Mar | Apr | May | Jun | Jul | Aug | Sep | Oct | Nov | Dec |
|---|---|---|---|---|---|---|---|---|---|---|---|---|
| 1993 | 4,120 | 3,498 | 3,307 | 3,422 | 3,637 | 3,010 | 3,845 | 3,863 | 3,722 | 4,043 | 3,947 | 3,834 |
| 1994 | 3,542 | 2,798 | 2,547 | 2,993 | 3,159 | 2,850 | 2,991 | 3,224 | 3,440 | 3,098 | 3,500 | 3,306 |
| 1995 | 2,714 | 2,932 | 2,511 | 2,422 | 3,083 | 2,625 | 2,610 | 2,820 | 2,716 | 2,885 | 3,177 | 3,254 |
| 1996 | 2,374 | 2,321 | 2,004 | 2,043 | 2,168 | 2,302 | 2,270 | 2,732 | 2,478 | 2,597 | 3,001 | 3,302 |
| 1997 | 2,821 | 2,495 | 2,368 | 2,303 | 2,278 | 2,720 | 2,586 | 2,570 | 2,593 | 2,762 | 2,996 | 3,034 |
| 1998 | 2,643 | 2,731 | 3,142 | 3,091 | 2,286 | 2,214 | 2,712 | 2,575 | 2,898 | 2,820 | 2,928 | 3,079 |
| 1999 | 2,779 | 2,783 | 2,797 | 2,587 | 2,658 | 2,579 | 2,793 | 2,654 | 2,640 | 2,744 | 2,995 | 2,780 |
| 2000 | 2,671 | 1,974 | 2,424 | 1,910 | 2,881 | 2,002 | 2,256 | 2,832 | 2,457 | 2,568 | 2,808 | 2,759 |
| 2001 | 2,777 | 2,887 | 2,541 | 2,319 | 2,236 | 2,800 | 2,630 | 2,298 | 2,424 | 2,675 | 2,821 | 2,386 |
| 2002 | 2,831 | 2,393 | 2,319 | 2,182 | 2,289 | 1,778 | 2,014 | 2,044 | 1,804 | 2,178 | 2,028 | 2,121 |
| 2003 | 1,957 | 2,742 | 1,979 | 2,190 | 1,857 | 1,623 | 2,285 | 2,347 | 2,573 | 2,883 | 2,793 | 2,932 |
| 2004 | 2,521 | 1,926 | 1,879 | 1,935 | 2,036 | 2,324 | 2,039 | 1,934 | 2,156 | 2,388 | 1,909 | 2,597 |
| 2005 | 2,539 | 2,413 | 2,293 | 2,487 | 2,170 | 2,652 | 2,423 | 2,776 | 2,543 | 2,157 | 2,883 | 2,949 |
| 2006 | 2,604 | 2,458 | 2,335 | 2,163 | 1,940 | 1,868 | 1,988 | 2,039 | 1,664 | 1,903 | 1,992 | 1,860 |
| 2007 | 2,162 | 1,770 | 1,626 | 1,881 | 1,799 | 2,177 | 1,822 | 1,780 | 1,606 | 1,452 | 1,792 | 1,976 |
| 2008 | 1,997 | 1,626 | 1,809 | 1,676 | 1,969 | 1,400 | 1,493 | 1,221 | 1,793 | 1,881 | 1,809 | 1,138 |
| 2009 | 1,552 | 1,556 | 1,129 | 1,396 | 1,026 | 1,057 | 877 | 1,060 | 1,029 | 1,245 | 863 | 1,095 |
| 2010 | 948 | 1,177 | 1,035 | 750 | 759 | 1,570 | 953 | 1,271 | 1,419 | 1,227 | 1,013 | 1,260 |
| 2011 | 1,087 | 1,056 | 1,155 | 1,000 | 996 | 871 | 1,119 | 1,063 | 928 | 771 | 817 | 1,198 |
| 2012 | 1,175 | 859 | 1,057 | 843 | 1,057 | 1,078 | 1,132 | 874 | 923 | 1,205 | 1,342 | 1,488 |
| 2013 | 1,072 | 1,051 | 1,050 | 1,029 | 1,080 | 1,162 | 1,734 | 1,811 | 1,178 | 1,717 | 1,433 | 1,436 |
| 2014 | 1,407 | 1,369 | 1,460 | 1,353 | 1,076 | 1,392 | 1,549 | 1,639 | 1,156 | 1,436 | 1,292 | 1,267 |
| 2015 | 1,344 | 1,214 | 1,287 | 1,159 | 992 | 1,248 | 1,031 | 1,518 | 1,126 | 1,160 | 1,096 | 1,482 |
| 2016 | 1,427 | 1,179 | 1,414 | 1,337 | 1,038 | 1,265 | 1,166 | 1,249 | 1,000 | 1,652 | 1,518 | 1,375 |
| 2017 | 1,534 | 1,394 | 1,221 | 1,244 | 1,239 | 1,264 | 1,134 | 1,403 | 958 | 1,156 | 1,379 | 1,058 |
| 2018 | 1,365 | 1,118 | 1,509 | 1,538 | 1,219 | 1,406 | 1,263 | 1,331 | 1,374 | 1,628 | 1,829 | 1,998 |
| 2019 | 1,744 | 1,837 | 1,673 | 1,599 | 1,307 | 1,202 | 1,513 | 1,818 | 1,631 | 1,736 | 1,511 | 1,639 |
| 2020 | 1,372 | 1,223 | 1,087 | 1,175 | 1,022 | 1,129 | 1,211 | 1,419 | 1,283 | 1,045 | 981 | 1,013 |
| 2021 | 1,107 | 1,141 | 1,210 | 1,249 | 1,632 | 1,239 | 1,135 | 1,433 | 1,082 | 1,379 | 1,152 | 865 |
| 2022 | 1,512 | 1,286 | 1,177 | 1,309 | 1,736 | 1,219 | 1,033 | 1,101 | 1,159 | 998 | 809 | 1,002 |
| 2023 | 1,273 | 1,157 | 1,220 | 1,085 | 989 | 1,004 | 1,092 | 943 | 846 | 921 | 800 | 877 |
| 2024 | 941 | |||||||||||
| - = No Data Reported; -- = Not Applicable; NA = Not Available; W = Withheld to avoid disclosure of individual company data. |
| Release Date: 3/29/2024 |
| Next Release Date: 4/30/2024 |