|
Download Data (XLS File) |
|
||||||||
|
||||||||
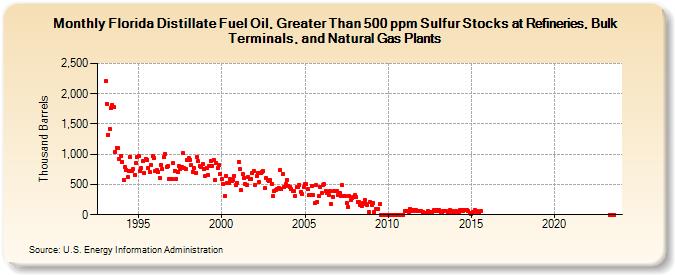
| Florida Distillate Fuel Oil, Greater Than 500 ppm Sulfur Stocks at Refineries, Bulk Terminals, and Natural Gas Plants (Thousand Barrels) | ||||||||
| Year | Jan | Feb | Mar | Apr | May | Jun | Jul | Aug | Sep | Oct | Nov | Dec |
|---|---|---|---|---|---|---|---|---|---|---|---|---|
| 1993 | 2,205 | 1,833 | 1,326 | 1,414 | 1,756 | 1,814 | 1,774 | 1,042 | 1,110 | 1,098 | 926 | 976 |
| 1994 | 878 | 578 | 795 | 744 | 625 | 722 | 956 | 721 | 753 | 649 | 852 | 958 |
| 1995 | 966 | 727 | 770 | 883 | 693 | 925 | 906 | 765 | 702 | 828 | 964 | 943 |
| 1996 | 726 | 733 | 703 | 615 | 827 | 758 | 950 | 1,011 | 794 | 798 | 595 | 589 |
| 1997 | 586 | 858 | 727 | 590 | 714 | 808 | 750 | 784 | 1,020 | 764 | 749 | 911 |
| 1998 | 932 | 906 | 817 | 714 | 767 | 696 | 957 | 880 | 802 | 790 | 845 | 761 |
| 1999 | 637 | 773 | 649 | 802 | 893 | 804 | 910 | 576 | 847 | 774 | 814 | 681 |
| 2000 | 586 | 506 | 310 | 647 | 523 | 518 | 588 | 559 | 567 | 648 | 489 | 529 |
| 2001 | 873 | 751 | 403 | 674 | 603 | 514 | 493 | 622 | 587 | 595 | 697 | 724 |
| 2002 | 499 | 640 | 697 | 539 | 694 | 703 | 715 | 434 | 604 | 566 | 551 | 571 |
| 2003 | 505 | 305 | 385 | 409 | 433 | 446 | 742 | 423 | 672 | 460 | 501 | 574 |
| 2004 | 482 | 460 | 418 | 394 | 385 | 315 | 459 | 464 | 497 | 383 | 338 | 460 |
| 2005 | 509 | 501 | 418 | 333 | 318 | 482 | 328 | 191 | 486 | 213 | 316 | 465 |
| 2006 | 352 | 490 | 502 | 395 | 357 | 327 | 386 | 183 | 301 | 390 | 395 | 388 |
| 2007 | 318 | 353 | 314 | 486 | 310 | 311 | 193 | 123 | 312 | 238 | 279 | 293 |
| 2008 | 320 | 295 | 215 | 210 | 165 | 136 | 199 | 246 | 170 | 162 | 43 | 210 |
| 2009 | 167 | 189 | 40 | 102 | 98 | 96 | 170 | 2 | 2 | 2 | 2 | 2 |
| 2010 | 2 | 1 | 1 | 1 | 1 | 1 | 1 | 1 | 2 | 2 | 2 | 2 |
| 2011 | 64 | 62 | 57 | 51 | 100 | 72 | 69 | 74 | 70 | 69 | 68 | 64 |
| 2012 | 59 | 45 | 33 | 29 | 22 | 58 | 50 | 39 | 51 | 70 | 56 | 74 |
| 2013 | 54 | 70 | 45 | 24 | 66 | 58 | 55 | 45 | 37 | 77 | 63 | 46 |
| 2014 | 26 | 61 | 47 | 31 | 75 | 71 | 69 | 75 | 79 | 73 | 63 | 32 |
| 2015 | 8 | 41 | 51 | 73 | 61 | 53 | 23 | 62 | ||||
| 2023 | 0 | 0 | 0 | 0 | ||||||||
| - = No Data Reported; -- = Not Applicable; NA = Not Available; W = Withheld to avoid disclosure of individual company data. |
| Release Date: 3/29/2024 |
| Next Release Date: 4/30/2024 |