|
Download Data (XLS File) |
|
||||||||
|
||||||||
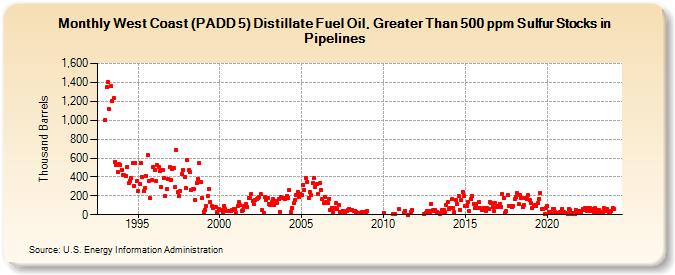
| West Coast (PADD 5) Distillate Fuel Oil, Greater Than 500 ppm Sulfur Stocks in Pipelines (Thousand Barrels) | ||||||||
| Year | Jan | Feb | Mar | Apr | May | Jun | Jul | Aug | Sep | Oct | Nov | Dec |
|---|---|---|---|---|---|---|---|---|---|---|---|---|
| 1993 | 1,002 | 1,348 | 1,402 | 1,114 | 1,361 | 1,206 | 1,230 | 562 | 528 | 450 | 536 | 531 |
| 1994 | 478 | 418 | 416 | 409 | 506 | 334 | 360 | 390 | 547 | 306 | 549 | 352 |
| 1995 | 251 | 330 | 550 | 403 | 247 | 278 | 405 | 629 | 359 | 172 | 362 | 507 |
| 1996 | 470 | 353 | 521 | 501 | 462 | 293 | 477 | 387 | 196 | 268 | 382 | 504 |
| 1997 | 368 | 484 | 497 | 291 | 686 | 237 | 203 | 252 | 426 | 477 | 404 | 287 |
| 1998 | 583 | 468 | 457 | 263 | 268 | 268 | 158 | 338 | 381 | 543 | 345 | 174 |
| 1999 | 33 | 55 | 90 | 195 | 270 | 139 | 89 | 75 | 85 | 79 | 32 | 62 |
| 2000 | 54 | 49 | 32 | 94 | 61 | 35 | 42 | 42 | 43 | 51 | 58 | 65 |
| 2001 | 13 | 88 | 131 | 98 | 42 | 47 | 90 | 111 | 82 | 175 | 175 | 224 |
| 2002 | 141 | 109 | 151 | 162 | 174 | 188 | 217 | 47 | 21 | 184 | 151 | 173 |
| 2003 | 112 | 108 | 131 | 163 | 105 | 148 | 129 | 164 | 31 | 184 | 180 | 179 |
| 2004 | 171 | 196 | 182 | 261 | 24 | 69 | 121 | 156 | 209 | 244 | 186 | 221 |
| 2005 | 210 | 315 | 262 | 392 | 351 | 178 | 242 | 208 | 334 | 385 | 297 | 327 |
| 2006 | 220 | 333 | 265 | 169 | 125 | 189 | 135 | 125 | 169 | 50 | 72 | 31 |
| 2007 | 71 | 119 | 60 | 104 | 28 | 28 | 44 | 28 | 28 | 43 | 54 | 64 |
| 2008 | 54 | 50 | 43 | 43 | 34 | 15 | 15 | 15 | 30 | 30 | 30 | 34 |
| 2009 | 42 | |||||||||||
| 2010 | 22 | 6 | 6 | 56 | ||||||||
| 2011 | 20 | 40 | 1 | 30 | 50 | |||||||
| 2012 | 6 | 18 | 42 | 44 | 18 | 117 | ||||||
| 2013 | 46 | 37 | 47 | 28 | 18 | 12 | 22 | 53 | 50 | 32 | 105 | 139 |
| 2014 | 64 | 71 | 165 | 70 | 24 | 160 | 111 | 199 | 51 | 157 | 244 | 203 |
| 2015 | 93 | 95 | 135 | 39 | 162 | 202 | 117 | 69 | 112 | 69 | 130 | 67 |
| 2016 | 52 | 53 | 76 | 35 | 66 | 57 | 138 | 129 | 80 | 36 | 121 | 83 |
| 2017 | 97 | 116 | 82 | 220 | 182 | 15 | 36 | 207 | 95 | 96 | 77 | 96 |
| 2018 | 163 | 184 | 226 | 109 | 208 | 181 | 82 | 100 | 173 | 164 | 204 | 152 |
| 2019 | 126 | 66 | 87 | 103 | 97 | 120 | 163 | 230 | 57 | 56 | 7 | 68 |
| 2020 | 88 | 34 | 31 | 13 | 59 | 65 | 24 | 14 | 17 | 28 | 24 | 63 |
| 2021 | 25 | 16 | 15 | 10 | 64 | 45 | 9 | 19 | 11 | 51 | 35 | 23 |
| 2022 | 38 | 28 | 59 | 55 | 75 | 35 | 67 | 72 | 35 | 59 | 34 | 66 |
| 2023 | 20 | 45 | 49 | 33 | 13 | 28 | 67 | 43 | 59 | 22 | 25 | 35 |
| 2024 | 71 | 62 | ||||||||||
| - = No Data Reported; -- = Not Applicable; NA = Not Available; W = Withheld to avoid disclosure of individual company data. |
| Release Date: 4/30/2024 |
| Next Release Date: 5/31/2024 |