|
Download Data (XLS File) |
|
||||||||
|
||||||||
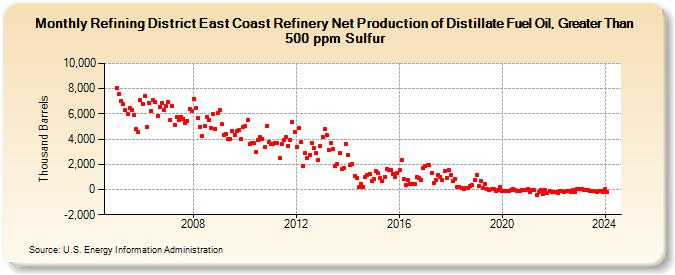
| Refining District East Coast Refinery Net Production of Distillate Fuel Oil, Greater Than 500 ppm Sulfur (Thousand Barrels) | ||||||||
| Year | Jan | Feb | Mar | Apr | May | Jun | Jul | Aug | Sep | Oct | Nov | Dec |
|---|---|---|---|---|---|---|---|---|---|---|---|---|
| 2005 | 8,017 | 7,539 | 7,037 | 6,746 | 6,306 | 5,993 | 6,463 | 6,312 | 5,929 | 4,823 | 4,597 | 7,107 |
| 2006 | 6,812 | 7,387 | 4,953 | 6,835 | 6,190 | 7,064 | 6,945 | 5,818 | 6,518 | 6,897 | 6,333 | 6,644 |
| 2007 | 6,954 | 5,533 | 6,591 | 5,151 | 5,772 | 5,525 | 5,780 | 5,605 | 5,269 | 5,450 | 6,357 | 6,195 |
| 2008 | 7,216 | 6,429 | 5,647 | 4,988 | 4,257 | 5,039 | 5,745 | 5,507 | 4,890 | 5,974 | 4,833 | 6,084 |
| 2009 | 6,340 | 5,181 | 4,355 | 4,411 | 3,987 | 3,970 | 4,670 | 4,348 | 4,655 | 4,739 | 3,979 | 4,942 |
| 2010 | 5,001 | 5,532 | 3,627 | 3,692 | 3,659 | 2,990 | 3,961 | 4,170 | 3,972 | 3,344 | 5,065 | 3,769 |
| 2011 | 3,612 | 3,603 | 3,706 | 3,671 | 2,486 | 3,596 | 3,916 | 4,137 | 3,468 | 3,890 | 5,332 | 4,530 |
| 2012 | 3,401 | 4,899 | 3,757 | 1,861 | 2,861 | 2,478 | 2,729 | 3,665 | 3,260 | 2,905 | 2,341 | 3,423 |
| 2013 | 4,182 | 4,801 | 4,335 | 3,140 | 3,713 | 3,247 | 1,870 | 2,034 | 2,877 | 1,594 | 1,717 | 3,646 |
| 2014 | 2,739 | 1,967 | 2,041 | 1,057 | 951 | 206 | 407 | 190 | 1,026 | 1,154 | 1,269 | 708 |
| 2015 | 848 | 1,440 | 1,299 | 900 | 658 | 1,019 | 1,653 | 1,581 | 1,566 | 1,231 | 1,001 | 1,308 |
| 2016 | 1,512 | 2,313 | 809 | 365 | 774 | 471 | 448 | 462 | 955 | 874 | 754 | 1,728 |
| 2017 | 1,837 | 1,919 | 1,906 | 1,330 | 549 | 724 | 1,158 | 1,030 | 775 | 1,503 | 922 | 1,519 |
| 2018 | 1,141 | 641 | 853 | 161 | 221 | 119 | 49 | 95 | 146 | 284 | 347 | 729 |
| 2019 | 1,175 | 241 | 714 | 107 | 444 | 18 | -43 | 31 | 23 | -126 | -49 | 211 |
| 2020 | -110 | -100 | -133 | -84 | -45 | 11 | -49 | -120 | -83 | -28 | -72 | -56 |
| 2021 | 75 | -195 | -76 | -50 | -425 | -220 | -29 | -386 | -39 | -269 | -137 | -216 |
| 2022 | -195 | -165 | -265 | -91 | -121 | -164 | -110 | -146 | -183 | -58 | -179 | 13 |
| 2023 | 79 | 2 | -12 | -9 | -23 | -142 | -86 | -117 | -165 | -98 | -90 | -175 |
| 2024 | 23 | |||||||||||
| - = No Data Reported; -- = Not Applicable; NA = Not Available; W = Withheld to avoid disclosure of individual company data. |
| Release Date: 3/29/2024 |
| Next Release Date: 4/30/2024 |