|
Download Data (XLS File) |
|
||||||||
|
||||||||
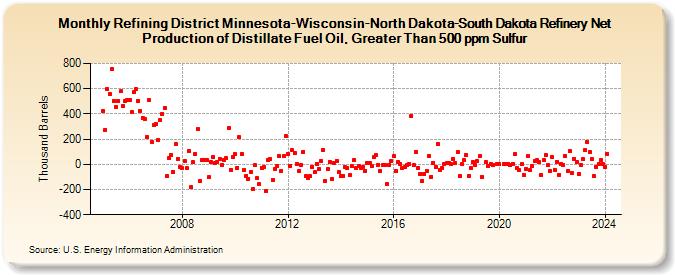
| Refining District Minnesota-Wisconsin-North Dakota-South Dakota Refinery Net Production of Distillate Fuel Oil, Greater Than 500 ppm Sulfur (Thousand Barrels) | ||||||||
| Year | Jan | Feb | Mar | Apr | May | Jun | Jul | Aug | Sep | Oct | Nov | Dec |
|---|---|---|---|---|---|---|---|---|---|---|---|---|
| 2005 | 422 | 273 | 597 | 559 | 757 | 503 | 457 | 506 | 578 | 465 | 502 | 509 |
| 2006 | 511 | 412 | 570 | 595 | 506 | 424 | 370 | 359 | 215 | 507 | 177 | 313 |
| 2007 | 317 | 196 | 349 | 403 | 448 | -94 | 48 | 74 | -62 | 158 | 46 | -23 |
| 2008 | -32 | 25 | -33 | 107 | -184 | 15 | 82 | 282 | -130 | 36 | 35 | 33 |
| 2009 | -104 | 19 | 57 | 11 | 16 | 43 | -2 | 37 | 47 | 286 | -43 | 59 |
| 2010 | 78 | -26 | 213 | 85 | -46 | -89 | -114 | -59 | -194 | -9 | -112 | -158 |
| 2011 | -26 | -25 | -215 | 33 | 39 | -123 | -34 | -16 | 64 | -52 | 62 | 223 |
| 2012 | 85 | -13 | 110 | 87 | 5 | -53 | -5 | 100 | -96 | -108 | -96 | -19 |
| 2013 | -64 | 6 | -40 | 29 | 114 | -132 | -38 | 22 | -115 | 10 | 30 | -64 |
| 2014 | -95 | -89 | -24 | -31 | -86 | -16 | 35 | -33 | -13 | -28 | -21 | -50 |
| 2015 | 10 | 12 | -14 | 57 | 71 | -3 | -54 | -6 | -5 | -159 | -4 | 26 |
| 2016 | 62 | -52 | 20 | 4 | -31 | -22 | -8 | 3 | 385 | -9 | 101 | -29 |
| 2017 | -73 | -134 | -80 | -53 | 69 | -97 | 14 | -23 | 161 | -47 | -28 | 0 |
| 2018 | 7 | 13 | -1 | 43 | 7 | 98 | -94 | 1 | 32 | 74 | -92 | -28 |
| 2019 | 18 | -5 | 28 | 64 | -97 | 16 | -17 | 1 | -6 | 4 | ||
| 2020 | -1 | -1 | 2 | 3 | -7 | 5 | 79 | -33 | -46 | 2 | -82 | |
| 2021 | -34 | 65 | -48 | -14 | 27 | 32 | 19 | -81 | 36 | 72 | -6 | -53 |
| 2022 | 57 | -43 | 21 | -82 | 3 | -3 | 64 | -51 | 103 | -70 | 45 | 15 |
| 2023 | -74 | -3 | 40 | 112 | 175 | 97 | 45 | -94 | -25 | 2 | 33 | -1 |
| 2024 | -20 | |||||||||||
| - = No Data Reported; -- = Not Applicable; NA = Not Available; W = Withheld to avoid disclosure of individual company data. |
| Release Date: 3/29/2024 |
| Next Release Date: 4/30/2024 |