|
Download Data (XLS File) |
|
||||||||
|
||||||||
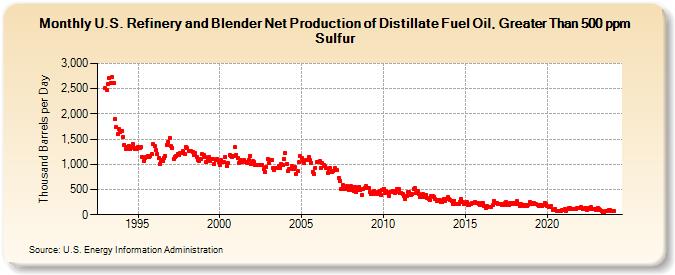
| U.S. Refinery and Blender Net Production of Distillate Fuel Oil, Greater Than 500 ppm Sulfur (Thousand Barrels per Day) | ||||||||
| Year | Jan | Feb | Mar | Apr | May | Jun | Jul | Aug | Sep | Oct | Nov | Dec |
|---|---|---|---|---|---|---|---|---|---|---|---|---|
| 1993 | 2,508 | 2,477 | 2,595 | 2,708 | 2,622 | 2,726 | 2,611 | 1,901 | 1,738 | 1,602 | 1,694 | 1,641 |
| 1994 | 1,669 | 1,539 | 1,386 | 1,311 | 1,339 | 1,368 | 1,298 | 1,336 | 1,401 | 1,331 | 1,301 | 1,312 |
| 1995 | 1,347 | 1,331 | 1,342 | 1,147 | 1,056 | 1,129 | 1,137 | 1,156 | 1,138 | 1,161 | 1,198 | 1,398 |
| 1996 | 1,363 | 1,282 | 1,201 | 1,120 | 1,011 | 1,077 | 1,073 | 1,126 | 1,173 | 1,383 | 1,452 | 1,523 |
| 1997 | 1,368 | 1,325 | 1,109 | 1,141 | 1,160 | 1,211 | 1,192 | 1,216 | 1,226 | 1,261 | 1,207 | 1,342 |
| 1998 | 1,316 | 1,256 | 1,260 | 1,259 | 1,241 | 1,184 | 1,216 | 1,146 | 1,077 | 1,067 | 1,115 | 1,196 |
| 1999 | 1,184 | 1,137 | 1,042 | 1,105 | 1,137 | 1,063 | 1,101 | 1,096 | 1,008 | 1,091 | 1,096 | 1,051 |
| 2000 | 990 | 1,080 | 1,042 | 1,045 | 1,147 | 960 | 1,034 | 1,177 | 1,164 | 1,142 | 1,159 | 1,337 |
| 2001 | 1,191 | 1,121 | 1,028 | 1,092 | 1,045 | 1,039 | 1,083 | 1,052 | 1,026 | 1,089 | 1,165 | 1,003 |
| 2002 | 1,060 | 1,042 | 990 | 990 | 979 | 985 | 995 | 996 | 905 | 848 | 945 | 1,103 |
| 2003 | 1,020 | 1,092 | 1,077 | 918 | 896 | 931 | 936 | 965 | 926 | 1,002 | 983 | 1,112 |
| 2004 | 1,224 | 1,011 | 869 | 903 | 908 | 960 | 909 | 938 | 811 | 867 | 1,039 | 1,164 |
| 2005 | 1,120 | 1,062 | 1,019 | 1,078 | 1,083 | 1,145 | 1,077 | 1,033 | 854 | 809 | 935 | 1,048 |
| 2006 | 1,044 | 1,065 | 928 | 1,016 | 995 | 963 | 919 | 834 | 903 | 926 | 851 | 859 |
| 2007 | 918 | 892 | 880 | 730 | 675 | 501 | 595 | 508 | 520 | 566 | 541 | 491 |
| 2008 | 560 | 498 | 466 | 551 | 452 | 495 | 555 | 487 | 397 | 512 | 524 | 567 |
| 2009 | 530 | 521 | 460 | 416 | 407 | 471 | 424 | 417 | 451 | 471 | 400 | 493 |
| 2010 | 520 | 440 | 463 | 421 | 373 | 451 | 442 | 470 | 433 | 455 | 507 | 507 |
| 2011 | 427 | 438 | 411 | 377 | 304 | 373 | 446 | 448 | 383 | 408 | 510 | 527 |
| 2012 | 429 | 475 | 408 | 343 | 387 | 402 | 346 | 399 | 339 | 317 | 298 | 363 |
| 2013 | 372 | 358 | 304 | 264 | 296 | 288 | 249 | 249 | 316 | 269 | 311 | 353 |
| 2014 | 314 | 293 | 269 | 215 | 281 | 215 | 219 | 218 | 262 | 310 | 260 | 203 |
| 2015 | 228 | 244 | 196 | 189 | 213 | 226 | 226 | 258 | 239 | 238 | 208 | 196 |
| 2016 | 237 | 234 | 171 | 132 | 167 | 156 | 153 | 160 | 191 | 281 | 226 | 236 |
| 2017 | 204 | 221 | 216 | 186 | 183 | 224 | 255 | 192 | 189 | 234 | 222 | 241 |
| 2018 | 241 | 219 | 266 | 206 | 170 | 211 | 199 | 171 | 184 | 175 | 193 | 251 |
| 2019 | 242 | 212 | 237 | 207 | 204 | 200 | 170 | 200 | 170 | 202 | 236 | 208 |
| 2020 | 173 | 158 | 148 | 167 | 103 | 84 | 116 | 81 | 72 | 70 | 76 | 86 |
| 2021 | 85 | 113 | 69 | 111 | 125 | 125 | 119 | 114 | 114 | 120 | 126 | 124 |
| 2022 | 138 | 144 | 109 | 107 | 125 | 102 | 138 | 114 | 148 | 106 | 120 | 109 |
| 2023 | 88 | 139 | 120 | 95 | 70 | 58 | 56 | 65 | 80 | 93 | 91 | 66 |
| 2024 | 74 | |||||||||||
| - = No Data Reported; -- = Not Applicable; NA = Not Available; W = Withheld to avoid disclosure of individual company data. |
| Release Date: 3/29/2024 |
| Next Release Date: 4/30/2024 |