|
Download Data (XLS File) |
|
||||||||
|
||||||||
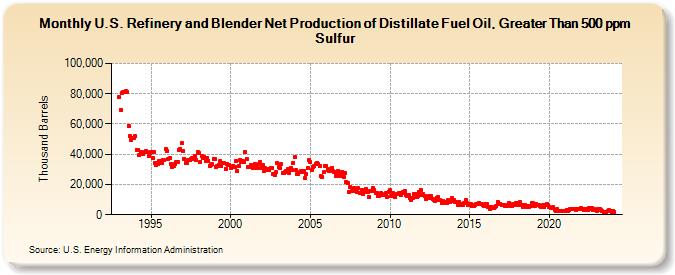
| U.S. Refinery and Blender Net Production of Distillate Fuel Oil, Greater Than 500 ppm Sulfur (Thousand Barrels) | ||||||||
| Year | Jan | Feb | Mar | Apr | May | Jun | Jul | Aug | Sep | Oct | Nov | Dec |
|---|---|---|---|---|---|---|---|---|---|---|---|---|
| 1993 | 77,750 | 69,357 | 80,438 | 81,249 | 81,275 | 81,782 | 80,954 | 58,931 | 52,141 | 49,661 | 50,830 | 50,873 |
| 1994 | 51,731 | 43,096 | 42,967 | 39,316 | 41,524 | 41,029 | 40,240 | 41,407 | 42,036 | 41,251 | 39,031 | 40,661 |
| 1995 | 41,757 | 37,275 | 41,599 | 34,413 | 32,736 | 33,859 | 35,257 | 35,827 | 34,148 | 35,995 | 35,941 | 43,324 |
| 1996 | 42,253 | 37,165 | 37,244 | 33,594 | 31,333 | 32,312 | 33,277 | 34,894 | 35,181 | 42,885 | 43,570 | 47,222 |
| 1997 | 42,407 | 37,095 | 34,376 | 34,233 | 35,968 | 36,344 | 36,958 | 37,695 | 36,780 | 39,087 | 36,221 | 41,590 |
| 1998 | 40,786 | 35,164 | 39,072 | 37,770 | 38,465 | 35,523 | 37,693 | 35,523 | 32,302 | 33,065 | 33,462 | 37,086 |
| 1999 | 36,693 | 31,832 | 32,295 | 33,157 | 35,262 | 31,902 | 34,139 | 33,979 | 30,244 | 33,821 | 32,890 | 32,571 |
| 2000 | 30,690 | 31,332 | 32,307 | 31,340 | 35,569 | 28,790 | 32,049 | 36,489 | 34,924 | 35,401 | 34,767 | 41,436 |
| 2001 | 36,935 | 31,390 | 31,868 | 32,761 | 32,385 | 31,160 | 33,587 | 32,600 | 30,786 | 33,768 | 34,939 | 31,099 |
| 2002 | 32,866 | 29,170 | 30,697 | 29,690 | 30,357 | 29,560 | 30,854 | 30,880 | 27,155 | 26,289 | 28,347 | 34,199 |
| 2003 | 31,612 | 30,582 | 33,401 | 27,531 | 27,772 | 27,920 | 29,015 | 29,917 | 27,793 | 31,053 | 29,499 | 34,472 |
| 2004 | 37,948 | 29,328 | 26,945 | 27,086 | 28,161 | 28,811 | 28,178 | 29,073 | 24,335 | 26,867 | 31,173 | 36,076 |
| 2005 | 34,714 | 29,744 | 31,602 | 32,336 | 33,577 | 34,341 | 33,386 | 32,038 | 25,613 | 25,085 | 28,041 | 32,480 |
| 2006 | 32,359 | 29,814 | 28,773 | 30,493 | 30,851 | 28,879 | 28,501 | 25,869 | 27,083 | 28,711 | 25,535 | 26,641 |
| 2007 | 28,455 | 24,966 | 27,286 | 21,897 | 20,932 | 15,038 | 18,452 | 15,745 | 15,585 | 17,549 | 16,235 | 15,206 |
| 2008 | 17,365 | 14,456 | 14,450 | 16,539 | 13,999 | 14,849 | 17,194 | 15,112 | 11,914 | 15,879 | 15,734 | 17,566 |
| 2009 | 16,430 | 14,596 | 14,254 | 12,477 | 12,632 | 14,116 | 13,151 | 12,919 | 13,543 | 14,595 | 11,998 | 15,277 |
| 2010 | 16,106 | 12,316 | 14,345 | 12,631 | 11,565 | 13,540 | 13,707 | 14,584 | 12,999 | 14,091 | 15,224 | 15,722 |
| 2011 | 13,229 | 12,264 | 12,751 | 11,303 | 9,432 | 11,200 | 13,813 | 13,897 | 11,485 | 12,641 | 15,302 | 16,322 |
| 2012 | 13,286 | 13,786 | 12,655 | 10,295 | 11,999 | 12,063 | 10,732 | 12,358 | 10,155 | 9,832 | 8,951 | 11,251 |
| 2013 | 11,534 | 10,018 | 9,437 | 7,929 | 9,175 | 8,634 | 7,727 | 7,721 | 9,475 | 8,333 | 9,334 | 10,931 |
| 2014 | 9,738 | 8,192 | 8,344 | 6,456 | 8,717 | 6,444 | 6,789 | 6,751 | 7,850 | 9,624 | 7,811 | 6,280 |
| 2015 | 7,057 | 6,824 | 6,081 | 5,678 | 6,617 | 6,769 | 7,021 | 7,998 | 7,165 | 7,384 | 6,250 | 6,077 |
| 2016 | 7,359 | 6,786 | 5,287 | 3,969 | 5,175 | 4,666 | 4,749 | 4,958 | 5,730 | 8,722 | 6,778 | 7,321 |
| 2017 | 6,325 | 6,179 | 6,694 | 5,570 | 5,663 | 6,713 | 7,906 | 5,957 | 5,660 | 7,262 | 6,646 | 7,485 |
| 2018 | 7,486 | 6,125 | 8,260 | 6,186 | 5,273 | 6,339 | 6,176 | 5,289 | 5,516 | 5,429 | 5,797 | 7,795 |
| 2019 | 7,516 | 5,927 | 7,361 | 6,206 | 6,310 | 6,002 | 5,261 | 6,200 | 5,096 | 6,253 | 7,066 | 6,454 |
| 2020 | 5,364 | 4,582 | 4,578 | 5,005 | 3,199 | 2,508 | 3,603 | 2,510 | 2,149 | 2,164 | 2,279 | 2,676 |
| 2021 | 2,643 | 3,155 | 2,136 | 3,328 | 3,883 | 3,746 | 3,693 | 3,538 | 3,408 | 3,705 | 3,779 | 3,846 |
| 2022 | 4,280 | 4,038 | 3,385 | 3,198 | 3,861 | 3,063 | 4,277 | 3,526 | 4,425 | 3,286 | 3,601 | 3,393 |
| 2023 | 2,734 | 3,884 | 3,715 | 2,857 | 2,178 | 1,730 | 1,745 | 2,007 | 2,403 | 2,871 | 2,736 | 2,042 |
| 2024 | 2,309 | |||||||||||
| - = No Data Reported; -- = Not Applicable; NA = Not Available; W = Withheld to avoid disclosure of individual company data. |
| Release Date: 3/29/2024 |
| Next Release Date: 4/30/2024 |