|
Download Data (XLS File) |
|
||||||||
|
||||||||
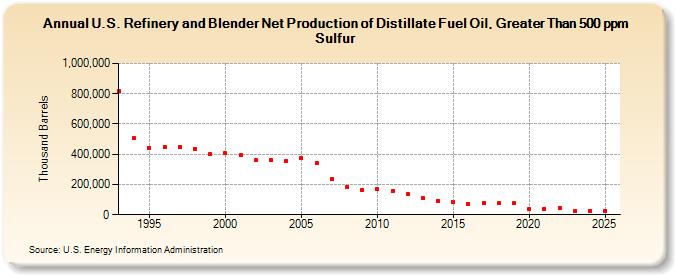
| U.S. Refinery and Blender Net Production of Distillate Fuel Oil, Greater Than 500 ppm Sulfur (Thousand Barrels) | ||||||||
| Decade | Year-0 | Year-1 | Year-2 | Year-3 | Year-4 | Year-5 | Year-6 | Year-7 | Year-8 | Year-9 |
|---|---|---|---|---|---|---|---|---|---|---|
| 1990's | 815,241 | 504,289 | 442,131 | 450,930 | 448,754 | 435,911 | 398,785 | |||
| 2000's | 405,094 | 393,278 | 360,064 | 360,567 | 353,981 | 372,957 | 343,509 | 237,346 | 185,057 | 165,988 |
| 2010's | 166,830 | 153,639 | 137,363 | 110,248 | 92,996 | 80,921 | 71,500 | 78,060 | 75,671 | 75,652 |
| 2020's | 40,617 | 40,860 | 44,333 | 27,446 |
| - = No Data Reported; -- = Not Applicable; NA = Not Available; W = Withheld to avoid disclosure of individual company data. |
| Release Date: 8/30/2024 |
| Next Release Date: 8/29/2025 |