|
Download Data (XLS File) |
|
||||||||
|
||||||||
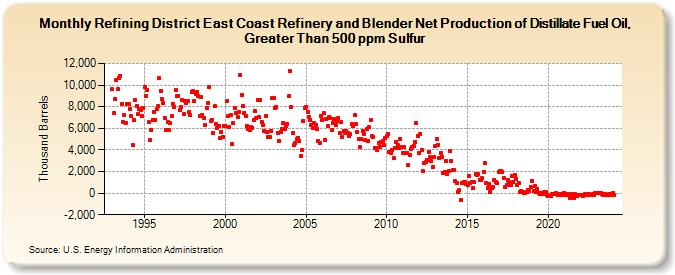
| Refining District East Coast Refinery and Blender Net Production of Distillate Fuel Oil, Greater Than 500 ppm Sulfur (Thousand Barrels) | ||||||||
| Year | Jan | Feb | Mar | Apr | May | Jun | Jul | Aug | Sep | Oct | Nov | Dec |
|---|---|---|---|---|---|---|---|---|---|---|---|---|
| 1993 | 9,598 | 7,374 | 8,690 | 10,464 | 9,610 | 10,699 | 10,887 | 8,229 | 6,558 | 7,192 | 6,515 | 8,255 |
| 1994 | 8,238 | 7,829 | 7,103 | 4,432 | 6,786 | 8,597 | 8,093 | 7,316 | 7,750 | 7,669 | 7,172 | 7,909 |
| 1995 | 9,855 | 8,972 | 9,571 | 6,549 | 4,936 | 5,853 | 6,792 | 7,520 | 6,786 | 7,755 | 8,071 | 10,618 |
| 1996 | 9,476 | 8,732 | 8,342 | 6,988 | 5,813 | 6,549 | 5,826 | 6,481 | 7,100 | 8,252 | 7,997 | 9,550 |
| 1997 | 9,004 | 8,995 | 7,673 | 8,003 | 8,633 | 7,307 | 8,568 | 8,373 | 8,489 | 7,501 | 7,216 | 9,344 |
| 1998 | 9,408 | 8,525 | 9,206 | 9,367 | 8,995 | 7,144 | 8,912 | 7,201 | 6,915 | 6,287 | 7,877 | 8,359 |
| 1999 | 9,849 | 6,648 | 6,803 | 5,606 | 8,023 | 6,441 | 5,995 | 6,178 | 5,064 | 5,671 | 5,211 | 6,242 |
| 2000 | 6,206 | 8,482 | 7,098 | 6,129 | 7,185 | 4,570 | 6,492 | 7,867 | 7,446 | 7,032 | 7,518 | 10,973 |
| 2001 | 9,054 | 8,089 | 7,442 | 7,165 | 6,171 | 5,893 | 5,854 | 6,099 | 6,068 | 6,813 | 7,556 | 6,939 |
| 2002 | 8,623 | 7,043 | 8,648 | 6,613 | 6,306 | 5,768 | 7,093 | 5,647 | 5,180 | 5,180 | 5,750 | 8,775 |
| 2003 | 8,849 | 7,882 | 7,984 | 5,588 | 4,792 | 5,687 | 5,944 | 6,491 | 5,899 | 6,183 | 6,373 | 8,980 |
| 2004 | 11,259 | 7,989 | 5,528 | 4,456 | 4,600 | 5,004 | 5,143 | 4,801 | 3,464 | 4,024 | 6,716 | 7,911 |
| 2005 | 8,017 | 7,539 | 7,037 | 6,746 | 6,306 | 5,993 | 6,463 | 6,312 | 5,929 | 4,823 | 4,597 | 7,107 |
| 2006 | 6,812 | 7,387 | 4,953 | 6,835 | 6,190 | 7,064 | 6,945 | 5,818 | 6,518 | 6,897 | 6,333 | 6,644 |
| 2007 | 6,954 | 5,533 | 6,591 | 5,151 | 5,772 | 5,525 | 5,780 | 5,605 | 5,269 | 5,450 | 6,357 | 6,195 |
| 2008 | 7,216 | 6,429 | 5,647 | 4,988 | 4,257 | 5,039 | 5,745 | 5,507 | 4,890 | 5,974 | 4,833 | 6,084 |
| 2009 | 6,799 | 5,253 | 5,235 | 4,183 | 4,219 | 3,964 | 4,606 | 4,275 | 4,751 | 4,801 | 4,416 | 5,143 |
| 2010 | 5,288 | 5,490 | 3,777 | 3,676 | 4,019 | 3,208 | 4,196 | 4,736 | 4,431 | 4,214 | 4,964 | 4,286 |
| 2011 | 3,668 | 4,244 | 3,732 | 3,692 | 2,637 | 3,519 | 4,088 | 4,235 | 4,381 | 4,754 | 6,478 | 5,274 |
| 2012 | 3,693 | 5,499 | 4,037 | 2,032 | 2,775 | 2,839 | 3,074 | 3,828 | 3,313 | 2,940 | 2,411 | 3,300 |
| 2013 | 4,377 | 4,976 | 4,493 | 3,231 | 3,745 | 3,322 | 1,881 | 1,983 | 2,980 | 1,775 | 2,053 | 3,898 |
| 2014 | 2,976 | 2,107 | 2,169 | 1,079 | 929 | 117 | 245 | -620 | 940 | 1,004 | 985 | 806 |
| 2015 | 715 | 1,570 | 946 | 1,021 | 439 | 989 | 1,723 | 1,650 | 1,768 | 1,247 | 1,196 | 1,365 |
| 2016 | 1,998 | 2,762 | 900 | 441 | 854 | 136 | 513 | 575 | 1,216 | 1,050 | 918 | 1,985 |
| 2017 | 2,074 | 2,055 | 1,933 | 1,405 | 596 | 734 | 1,207 | 1,003 | 753 | 1,595 | 1,039 | 1,701 |
| 2018 | 1,283 | 724 | 967 | 139 | 197 | 106 | 5 | 19 | 100 | 329 | 193 | 597 |
| 2019 | 1,146 | 205 | 665 | 107 | 410 | -34 | -75 | 25 | -121 | 88 | 77 | -131 |
| 2020 | -312 | -235 | -275 | -115 | -68 | -71 | -34 | -142 | -89 | -90 | -164 | -65 |
| 2021 | 53 | -206 | -118 | -83 | -435 | -258 | -58 | -440 | -62 | -270 | -158 | -213 |
| 2022 | -213 | -189 | -289 | -95 | -124 | -191 | -117 | -176 | -185 | -86 | -183 | -12 |
| 2023 | 53 | -24 | -12 | -9 | -52 | -168 | -87 | -133 | -167 | -127 | -118 | -175 |
| 2024 | -2 | |||||||||||
| - = No Data Reported; -- = Not Applicable; NA = Not Available; W = Withheld to avoid disclosure of individual company data. |
| Release Date: 3/29/2024 |
| Next Release Date: 4/30/2024 |