|
Download Data (XLS File) |
|
||||||||
|
||||||||
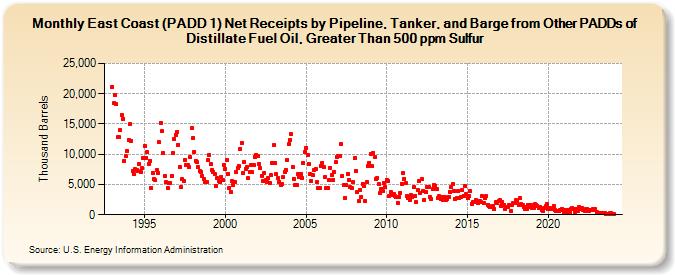
| East Coast (PADD 1) Net Receipts by Pipeline, Tanker, and Barge from Other PADDs of Distillate Fuel Oil, Greater Than 500 ppm Sulfur (Thousand Barrels) | ||||||||
| Year | Jan | Feb | Mar | Apr | May | Jun | Jul | Aug | Sep | Oct | Nov | Dec |
|---|---|---|---|---|---|---|---|---|---|---|---|---|
| 1993 | 21,136 | 18,387 | 19,830 | 18,242 | 12,786 | 12,785 | 13,990 | 16,467 | 15,881 | 8,930 | 9,660 | 10,533 |
| 1994 | 12,319 | 14,938 | 12,261 | 7,222 | 6,685 | 7,496 | 7,413 | 7,158 | 8,445 | 7,052 | 7,701 | 9,384 |
| 1995 | 11,424 | 9,439 | 10,288 | 8,411 | 8,933 | 4,450 | 6,917 | 5,834 | 5,695 | 7,403 | 6,955 | 11,975 |
| 1996 | 15,230 | 13,779 | 10,216 | 6,456 | 5,364 | 4,421 | 5,310 | 5,252 | 6,474 | 10,151 | 12,575 | 13,214 |
| 1997 | 13,690 | 11,607 | 7,869 | 4,585 | 5,897 | 5,607 | 9,106 | 8,223 | 8,197 | 7,830 | 9,536 | 14,295 |
| 1998 | 12,686 | 10,430 | 8,902 | 8,642 | 7,810 | 7,250 | 7,125 | 6,318 | 5,832 | 5,482 | 5,459 | 9,051 |
| 1999 | 9,870 | 8,378 | 7,391 | 7,107 | 6,668 | 4,732 | 6,003 | 5,612 | 5,351 | 6,253 | 5,663 | 8,279 |
| 2000 | 7,577 | 9,053 | 6,772 | 4,450 | 3,821 | 5,539 | 4,912 | 5,464 | 7,009 | 7,766 | 7,977 | 10,850 |
| 2001 | 11,888 | 6,838 | 8,702 | 7,635 | 7,846 | 6,055 | 7,133 | 8,166 | 7,019 | 8,204 | 9,588 | 9,937 |
| 2002 | 9,733 | 8,354 | 7,666 | 6,409 | 5,563 | 6,938 | 5,681 | 5,480 | 5,998 | 5,207 | 6,505 | 8,599 |
| 2003 | 11,488 | 8,586 | 6,664 | 6,038 | 5,465 | 4,871 | 5,035 | 6,230 | 7,131 | 7,450 | 9,049 | 11,633 |
| 2004 | 12,272 | 13,278 | 7,935 | 5,945 | 4,872 | 4,850 | 6,676 | 6,270 | 6,759 | 6,103 | 8,553 | 10,406 |
| 2005 | 11,088 | 9,810 | 8,383 | 6,701 | 5,596 | 6,498 | 7,313 | 7,542 | 5,468 | 4,446 | 4,455 | 8,093 |
| 2006 | 8,550 | 7,957 | 6,212 | 4,465 | 4,474 | 5,692 | 7,800 | 6,552 | 5,794 | 7,093 | 8,633 | 9,515 |
| 2007 | 9,736 | 9,668 | 11,682 | 6,433 | 4,854 | 2,845 | 4,885 | 6,775 | 5,811 | 4,516 | 4,457 | 5,380 |
| 2008 | 9,304 | 7,287 | 3,686 | 2,222 | 4,142 | 2,931 | 5,122 | 4,686 | 2,240 | 5,332 | 8,088 | 8,613 |
| 2009 | 10,088 | 8,014 | 10,213 | 9,523 | 5,846 | 6,055 | 5,046 | 3,604 | 4,308 | 3,842 | 5,289 | 4,524 |
| 2010 | 5,788 | 5,552 | 3,173 | 3,673 | 3,191 | 3,486 | 3,135 | 2,876 | 1,990 | 2,985 | 3,654 | 5,156 |
| 2011 | 6,862 | 5,982 | 5,167 | 3,097 | 2,717 | 2,409 | 3,196 | 2,966 | 4,573 | 3,176 | 2,090 | 4,082 |
| 2012 | 5,575 | 3,594 | 5,891 | 3,928 | 2,477 | 3,720 | 4,562 | 4,562 | 2,937 | 2,574 | 4,225 | 4,902 |
| 2013 | 4,828 | 4,255 | 2,749 | 3,042 | 2,541 | 2,875 | 2,393 | 2,897 | 2,455 | 2,673 | 2,941 | 3,802 |
| 2014 | 4,544 | 5,010 | 3,939 | 2,635 | 2,753 | 3,912 | 2,836 | 2,929 | 4,074 | 3,108 | 4,805 | 3,355 |
| 2015 | 2,759 | 3,079 | 3,863 | 1,825 | 2,182 | 2,054 | 2,386 | 2,207 | 1,934 | 2,290 | 2,028 | 3,064 |
| 2016 | 1,959 | 2,752 | 3,047 | 1,668 | 1,392 | 1,313 | 1,294 | 1,497 | 954 | 2,037 | 1,958 | 2,278 |
| 2017 | 2,387 | 1,371 | 2,128 | 1,686 | 889 | 1,304 | 1,308 | 1,582 | 685 | 1,605 | 1,906 | 1,921 |
| 2018 | 2,382 | 2,304 | 1,571 | 2,762 | 1,739 | 1,565 | 1,330 | 1,004 | 924 | 1,614 | 1,231 | 1,671 |
| 2019 | 1,170 | 1,124 | 1,717 | 1,673 | 1,516 | 1,094 | 1,293 | 833 | 618 | 1,042 | 1,372 | 1,760 |
| 2020 | 1,021 | 1,164 | 940 | 986 | 1,459 | 854 | 542 | 577 | 555 | 776 | 997 | 861 |
| 2021 | 522 | 723 | 320 | 721 | 406 | 1,016 | 1,063 | 909 | 488 | 936 | 666 | 1,210 |
| 2022 | 1,023 | 1,040 | 837 | 683 | 941 | 957 | 598 | 801 | 804 | 895 | 723 | 896 |
| 2023 | 388 | 308 | 226 | 246 | 332 | 244 | 231 | 111 | 198 | 188 | 288 | 214 |
| 2024 | 161 | |||||||||||
| - = No Data Reported; -- = Not Applicable; NA = Not Available; W = Withheld to avoid disclosure of individual company data. |
| Release Date: 3/29/2024 |
| Next Release Date: 4/30/2024 |
Referring Pages: