|
Download Data (XLS File) |
|
||||||||
|
||||||||
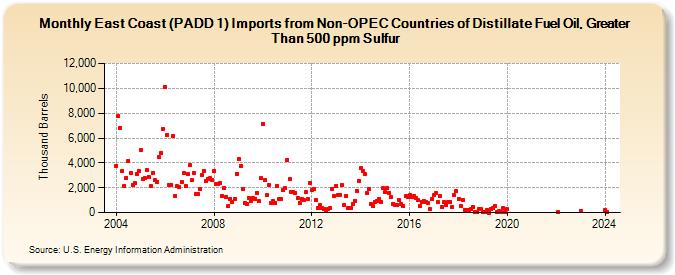
| East Coast (PADD 1) Imports from Non-OPEC Countries of Distillate Fuel Oil, Greater Than 500 ppm Sulfur (Thousand Barrels) | ||||||||
| Year | Jan | Feb | Mar | Apr | May | Jun | Jul | Aug | Sep | Oct | Nov | Dec |
|---|---|---|---|---|---|---|---|---|---|---|---|---|
| 2004 | 3,763 | 7,797 | 6,830 | 3,352 | 2,173 | 2,810 | 4,178 | 3,207 | 2,235 | 2,347 | 3,094 | 3,374 |
| 2005 | 5,011 | 2,725 | 2,774 | 3,462 | 2,900 | 2,136 | 3,186 | 2,584 | 2,499 | 4,437 | 4,795 | 6,728 |
| 2006 | 10,109 | 6,251 | 2,224 | 2,249 | 6,176 | 1,365 | 2,114 | 2,038 | 2,479 | 3,200 | 2,167 | 3,104 |
| 2007 | 3,800 | 2,605 | 3,199 | 1,510 | 1,495 | 1,877 | 3,027 | 3,356 | 2,559 | 2,710 | 2,759 | 2,606 |
| 2008 | 3,385 | 2,310 | 2,304 | 2,373 | 1,357 | 1,988 | 1,250 | 552 | 1,127 | 852 | 1,087 | 3,127 |
| 2009 | 4,292 | 3,762 | 1,915 | 777 | 728 | 1,184 | 934 | 1,163 | 1,108 | 1,614 | 911 | 2,749 |
| 2010 | 7,160 | 2,598 | 1,418 | 2,212 | 773 | 932 | 771 | 2,149 | 1,089 | 1,060 | 1,786 | 1,941 |
| 2011 | 4,261 | 2,699 | 1,665 | 1,684 | 1,557 | 1,158 | 759 | 1,079 | 972 | 1,627 | 1,082 | 2,402 |
| 2012 | 1,781 | 1,883 | 1,000 | 349 | 615 | 349 | 286 | 227 | 302 | 343 | 1,900 | 1,346 |
| 2013 | 2,163 | 1,385 | 1,436 | 2,218 | 612 | 1,320 | 346 | 357 | 698 | 936 | 1,774 | 2,547 |
| 2014 | 3,602 | 3,333 | 3,085 | 1,582 | 1,914 | 676 | 531 | 877 | 949 | 1,082 | 835 | 1,955 |
| 2015 | 1,682 | 1,958 | 1,602 | 1,238 | 729 | 647 | 575 | 977 | 666 | 548 | 1,310 | 1,256 |
| 2016 | 1,393 | 1,258 | 1,359 | 1,171 | 999 | 548 | 883 | 963 | 833 | 779 | 247 | 1,101 |
| 2017 | 1,414 | 1,610 | 810 | 1,311 | 448 | 828 | 590 | 871 | 848 | 437 | 1,383 | 1,707 |
| 2018 | 1,111 | 555 | 1,050 | 237 | 190 | 196 | 254 | 486 | 10 | 11 | 278 | 264 |
| 2019 | 21 | 11 | 197 | 2 | 302 | 340 | 490 | 13 | 159 | 12 | 367 | 7 |
| 2020 | 263 | |||||||||||
| 2022 | 62 | |||||||||||
| 2023 | 131 | |||||||||||
| 2024 | 221 | 70 | 90 | |||||||||
| - = No Data Reported; -- = Not Applicable; NA = Not Available; W = Withheld to avoid disclosure of individual company data. |
| Release Date: 8/30/2024 |
| Next Release Date: 9/30/2024 |