|
Download Data (XLS File) |
|
||||||||
|
||||||||
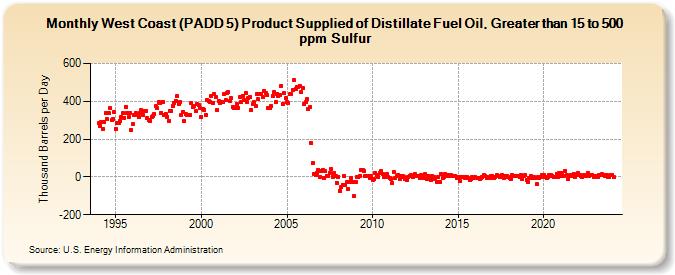
| West Coast (PADD 5) Product Supplied of Distillate Fuel Oil, Greater than 15 to 500 ppm Sulfur (Thousand Barrels per Day) | ||||||||
| Year | Jan | Feb | Mar | Apr | May | Jun | Jul | Aug | Sep | Oct | Nov | Dec |
|---|---|---|---|---|---|---|---|---|---|---|---|---|
| 1994 | 284 | 271 | 293 | 254 | 293 | 340 | 306 | 339 | 364 | 299 | 306 | 342 |
| 1995 | 255 | 284 | 285 | 297 | 319 | 338 | 314 | 372 | 337 | 317 | 339 | 250 |
| 1996 | 278 | 326 | 340 | 325 | 315 | 336 | 352 | 329 | 349 | 350 | 312 | 303 |
| 1997 | 298 | 319 | 322 | 335 | 375 | 363 | 394 | 389 | 340 | 397 | 326 | 335 |
| 1998 | 318 | 296 | 350 | 351 | 374 | 393 | 402 | 426 | 387 | 396 | 330 | 344 |
| 1999 | 295 | 331 | 330 | 326 | 330 | 392 | 371 | 376 | 347 | 388 | 380 | 364 |
| 2000 | 319 | 358 | 355 | 330 | 409 | 403 | 397 | 427 | 391 | 436 | 421 | 354 |
| 2001 | 403 | 390 | 395 | 396 | 438 | 407 | 443 | 450 | 400 | 417 | 369 | 364 |
| 2002 | 362 | 387 | 367 | 422 | 397 | 430 | 406 | 444 | 398 | 416 | 425 | 356 |
| 2003 | 384 | 394 | 374 | 437 | 410 | 441 | 437 | 423 | 457 | 446 | 433 | 362 |
| 2004 | 367 | 375 | 427 | 449 | 397 | 439 | 430 | 434 | 480 | 387 | 445 | 415 |
| 2005 | 397 | 392 | 437 | 441 | 460 | 510 | 466 | 476 | 476 | 481 | 447 | 470 |
| 2006 | 387 | 395 | 411 | 358 | 370 | 179 | 72 | 18 | 10 | 23 | 37 | 1 |
| 2007 | 29 | 39 | -6 | 29 | 7 | 5 | 21 | 42 | 2 | 21 | 5 | -30 |
| 2008 | 2 | -72 | -54 | -41 | 6 | -44 | -29 | -64 | -27 | -5 | -25 | -103 |
| 2009 | -27 | 1 | -3 | 4 | 36 | 35 | 32 | 4 | 7 | 5 | -6 | 4 |
| 2010 | -15 | -13 | 20 | 11 | 1 | 22 | 31 | 14 | 2 | 5 | 14 | -3 |
| 2011 | -5 | -10 | -31 | 26 | -5 | 5 | 12 | -9 | 6 | 4 | 0 | -11 |
| 2012 | -18 | 1 | 7 | 9 | -3 | 6 | 13 | 4 | 7 | -5 | 9 | -1 |
| 2013 | -4 | 13 | -10 | 5 | -12 | -15 | 4 | 2 | -13 | -25 | -3 | -26 |
| 2014 | 13 | -5 | 1 | 18 | 9 | 6 | 10 | 10 | 7 | 3 | 5 | -6 |
| 2015 | 1 | -24 | 2 | -3 | 1 | -8 | 0 | -8 | -15 | -12 | -3 | -5 |
| 2016 | 2 | -4 | -4 | -10 | -8 | -1 | 11 | 5 | -6 | -1 | -7 | 4 |
| 2017 | 7 | -6 | 2 | 9 | 4 | 2 | 5 | 11 | -5 | 4 | 3 | 2 |
| 2018 | -6 | -9 | 9 | 4 | 7 | 7 | 3 | -3 | 9 | -9 | 5 | 8 |
| 2019 | -15 | -28 | -5 | 7 | -6 | -1 | -8 | -39 | -2 | -6 | -1 | 11 |
| 2020 | 10 | 0 | -6 | 1 | 11 | 8 | 7 | 2 | -3 | 17 | 0 | 22 |
| 2021 | 3 | 19 | 7 | 33 | 11 | -12 | 6 | 9 | 5 | 17 | 0 | 11 |
| 2022 | 20 | 10 | 5 | 0 | 11 | 7 | 5 | 21 | 7 | 10 | 9 | -2 |
| 2023 | 5 | 4 | 2 | 11 | 8 | 13 | 11 | 7 | 9 | 0 | 0 | 12 |
| 2024 | 10 | |||||||||||
| - = No Data Reported; -- = Not Applicable; NA = Not Available; W = Withheld to avoid disclosure of individual company data. |
| Release Date: 3/29/2024 |
| Next Release Date: 4/30/2024 |