|
Download Data (XLS File) |
|
||||||||
|
||||||||
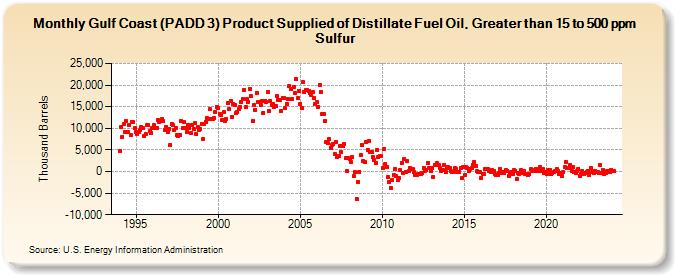
| Gulf Coast (PADD 3) Product Supplied of Distillate Fuel Oil, Greater than 15 to 500 ppm Sulfur (Thousand Barrels) | ||||||||
| Year | Jan | Feb | Mar | Apr | May | Jun | Jul | Aug | Sep | Oct | Nov | Dec |
|---|---|---|---|---|---|---|---|---|---|---|---|---|
| 1994 | 4,748 | 10,343 | 8,030 | 10,937 | 9,198 | 11,674 | 9,122 | 10,789 | 8,431 | 11,484 | 11,453 | 10,103 |
| 1995 | 9,216 | 8,745 | 9,056 | 9,687 | 10,346 | 10,100 | 8,264 | 8,761 | 10,807 | 10,742 | 9,372 | 8,936 |
| 1996 | 10,002 | 10,744 | 10,081 | 10,015 | 11,953 | 11,345 | 11,690 | 12,179 | 11,610 | 9,566 | 10,368 | 9,125 |
| 1997 | 9,856 | 6,158 | 10,979 | 10,647 | 9,708 | 10,177 | 8,357 | 8,279 | 8,358 | 11,621 | 10,063 | 11,360 |
| 1998 | 10,024 | 9,154 | 10,790 | 10,115 | 9,018 | 10,669 | 9,874 | 11,143 | 8,594 | 10,236 | 9,636 | 9,792 |
| 1999 | 11,001 | 7,626 | 11,033 | 11,493 | 12,280 | 12,251 | 14,376 | 12,102 | 12,215 | 12,389 | 13,717 | 15,039 |
| 2000 | 14,669 | 13,276 | 13,071 | 12,007 | 13,671 | 11,673 | 12,154 | 15,846 | 14,464 | 16,276 | 12,722 | 15,575 |
| 2001 | 15,506 | 13,566 | 13,741 | 14,398 | 14,902 | 16,005 | 16,731 | 18,837 | 14,855 | 16,740 | 16,177 | 19,157 |
| 2002 | 17,468 | 11,724 | 15,360 | 14,325 | 18,245 | 16,131 | 16,019 | 15,345 | 16,363 | 13,608 | 16,415 | 16,182 |
| 2003 | 18,355 | 13,948 | 16,259 | 15,404 | 15,580 | 14,941 | 15,223 | 17,455 | 16,489 | 16,471 | 13,933 | 17,093 |
| 2004 | 17,001 | 14,594 | 15,588 | 16,805 | 19,734 | 19,086 | 16,835 | 19,604 | 18,099 | 21,303 | 16,950 | 18,521 |
| 2005 | 15,707 | 14,642 | 20,628 | 18,358 | 18,917 | 18,852 | 18,591 | 18,082 | 17,713 | 18,392 | 17,003 | 15,644 |
| 2006 | 15,999 | 14,961 | 20,111 | 18,389 | 13,347 | 13,358 | 11,786 | 6,861 | 6,568 | 7,589 | 5,537 | 6,061 |
| 2007 | 6,324 | 4,007 | 6,906 | 3,259 | 3,647 | 5,945 | 4,493 | 5,882 | 6,345 | 3,105 | 187 | 3,124 |
| 2008 | 2,801 | 2,168 | 3,412 | -1,083 | -221 | -6,269 | -2,389 | -1 | 3,815 | 6,153 | 2,381 | 2,148 |
| 2009 | 6,726 | 5,089 | 7,038 | 4,587 | 4,513 | 3,332 | 2,671 | 1,936 | 5,070 | 3,337 | 3,671 | 3,640 |
| 2010 | 804 | 5,313 | 1,826 | 1,088 | -1,166 | -2,463 | -3,772 | -1,993 | -706 | 516 | -1,150 | -2,026 |
| 2011 | -1,515 | 244 | 2,034 | -347 | 2,783 | -32 | 2,537 | 103 | 896 | 583 | 469 | -218 |
| 2012 | -860 | -825 | -537 | -650 | -627 | -426 | 874 | 217 | 313 | 2,064 | 791 | 226 |
| 2013 | 901 | -1,318 | 1,549 | 1,599 | 1,896 | 1,542 | 893 | 64 | 396 | 1,457 | -203 | 913 |
| 2014 | 928 | 712 | 93 | -71 | -229 | 796 | 500 | -77 | -37 | 735 | -1,605 | 1,153 |
| 2015 | -758 | 934 | 836 | 131 | 654 | 731 | 1,586 | 2,197 | 1,272 | 115 | -183 | -197 |
| 2016 | -1,517 | -511 | -679 | 632 | 503 | 557 | 230 | -84 | 295 | 67 | -618 | -884 |
| 2017 | -756 | -331 | 629 | -284 | -23 | -387 | 237 | 228 | -1,017 | -287 | -189 | -627 |
| 2018 | 247 | 173 | -1,664 | -297 | -467 | 233 | -428 | 205 | -558 | -469 | -819 | -559 |
| 2019 | 498 | 398 | 47 | 41 | 624 | 154 | 187 | 987 | 221 | 616 | -327 | -205 |
| 2020 | -556 | 404 | 428 | -630 | -443 | -24 | 160 | 564 | 27 | -517 | -313 | -1,055 |
| 2021 | -229 | 1,093 | 2,205 | 781 | 796 | 1,476 | 219 | 1,147 | -222 | -395 | 119 | 644 |
| 2022 | -962 | -559 | 229 | -515 | -345 | -25 | 193 | -842 | 823 | -198 | -382 | 132 |
| 2023 | -107 | -46 | -244 | 1,403 | -314 | 258 | -495 | -316 | 76 | 14 | -92 | 359 |
| 2024 | 147 | |||||||||||
| - = No Data Reported; -- = Not Applicable; NA = Not Available; W = Withheld to avoid disclosure of individual company data. |
| Release Date: 3/29/2024 |
| Next Release Date: 4/30/2024 |