|
Download Data (XLS File) |
|
||||||||
|
||||||||
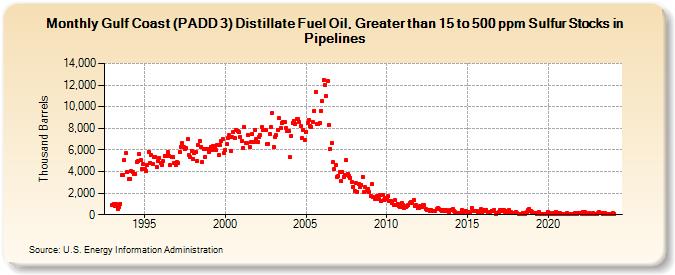
| Gulf Coast (PADD 3) Distillate Fuel Oil, Greater than 15 to 500 ppm Sulfur Stocks in Pipelines (Thousand Barrels) | ||||||||
| Year | Jan | Feb | Mar | Apr | May | Jun | Jul | Aug | Sep | Oct | Nov | Dec |
|---|---|---|---|---|---|---|---|---|---|---|---|---|
| 1993 | 865 | 1,016 | 761 | 968 | 540 | 711 | 1,036 | 3,676 | 3,714 | 5,079 | 5,692 | 3,967 |
| 1994 | 3,302 | 3,350 | 4,044 | 3,965 | 3,783 | 3,807 | 4,885 | 4,950 | 5,600 | 5,050 | 4,238 | 4,673 |
| 1995 | 4,240 | 4,019 | 4,560 | 5,836 | 4,795 | 5,496 | 4,715 | 5,344 | 5,388 | 4,405 | 4,940 | 5,270 |
| 1996 | 4,796 | 4,623 | 4,947 | 5,474 | 5,480 | 5,763 | 5,451 | 4,582 | 5,352 | 5,312 | 4,799 | 4,578 |
| 1997 | 4,873 | 4,753 | 5,785 | 6,275 | 6,608 | 6,264 | 6,094 | 6,158 | 6,997 | 5,541 | 5,319 | 5,903 |
| 1998 | 5,128 | 5,689 | 5,766 | 5,011 | 6,415 | 6,845 | 6,282 | 4,858 | 6,074 | 5,384 | 6,094 | 6,073 |
| 1999 | 5,781 | 6,306 | 6,029 | 6,390 | 6,287 | 5,961 | 6,469 | 5,514 | 6,474 | 6,866 | 6,991 | 5,692 |
| 2000 | 5,997 | 6,534 | 7,115 | 7,373 | 5,912 | 7,189 | 7,701 | 7,062 | 7,838 | 7,732 | 7,669 | 7,222 |
| 2001 | 6,829 | 6,187 | 8,140 | 6,605 | 6,603 | 7,342 | 6,277 | 6,730 | 7,460 | 6,757 | 7,871 | 6,970 |
| 2002 | 6,706 | 7,195 | 7,364 | 8,089 | 7,847 | 7,883 | 7,842 | 6,542 | 6,570 | 7,512 | 8,116 | 9,424 |
| 2003 | 6,266 | 7,224 | 7,344 | 7,861 | 8,947 | 7,990 | 8,529 | 8,623 | 8,590 | 8,008 | 7,736 | 7,769 |
| 2004 | 5,305 | 7,325 | 8,529 | 8,720 | 8,432 | 8,856 | 8,817 | 8,563 | 8,170 | 7,070 | 7,831 | 6,952 |
| 2005 | 7,662 | 8,522 | 8,784 | 8,201 | 8,111 | 8,585 | 9,612 | 11,327 | 8,386 | 8,361 | 8,471 | 9,630 |
| 2006 | 10,483 | 12,458 | 12,047 | 10,970 | 12,422 | 8,279 | 6,108 | 6,639 | 4,836 | 4,217 | 4,613 | 3,487 |
| 2007 | 3,568 | 3,968 | 3,080 | 3,977 | 3,521 | 3,707 | 5,027 | 3,813 | 3,598 | 3,431 | 3,017 | 2,603 |
| 2008 | 2,240 | 2,895 | 2,132 | 2,822 | 2,534 | 2,771 | 3,529 | 2,074 | 2,533 | 2,179 | 2,397 | 2,108 |
| 2009 | 1,726 | 2,816 | 1,629 | 1,498 | 1,585 | 1,706 | 1,476 | 1,848 | 1,262 | 1,812 | 1,340 | 1,545 |
| 2010 | 1,490 | 1,689 | 1,242 | 1,259 | 1,110 | 903 | 1,348 | 944 | 1,026 | 781 | 698 | 1,114 |
| 2011 | 907 | 617 | 738 | 822 | 865 | 1,070 | 1,137 | 1,068 | 1,367 | 835 | 911 | 642 |
| 2012 | 620 | 830 | 756 | 939 | 873 | 522 | 405 | 396 | 345 | 439 | 373 | 384 |
| 2013 | 346 | 544 | 576 | 527 | 402 | 336 | 412 | 309 | 473 | 320 | 259 | 391 |
| 2014 | 394 | 523 | 386 | 229 | 175 | 179 | 146 | 175 | 422 | 234 | 324 | 345 |
| 2015 | 228 | 233 | 181 | 634 | 367 | 335 | 338 | 309 | 169 | 219 | 502 | 261 |
| 2016 | 438 | 324 | 454 | 226 | 263 | 297 | 371 | 340 | 437 | 104 | 181 | 231 |
| 2017 | 413 | 310 | 480 | 409 | 275 | 330 | 289 | 408 | 242 | 181 | 176 | 167 |
| 2018 | 283 | 122 | 107 | 86 | 56 | 141 | 156 | 100 | 209 | 393 | 532 | 315 |
| 2019 | 270 | 153 | 140 | 141 | 93 | 213 | 67 | 103 | 73 | 49 | 49 | 98 |
| 2020 | 255 | 131 | 72 | 104 | 120 | 60 | 231 | 135 | 111 | 124 | 51 | 84 |
| 2021 | 72 | 72 | 153 | 86 | 62 | 98 | 87 | 104 | 116 | 101 | 121 | 135 |
| 2022 | 129 | 95 | 234 | 234 | 67 | 80 | 128 | 78 | 83 | 129 | 103 | 100 |
| 2023 | 97 | 133 | 218 | 181 | 201 | 111 | 168 | 56 | 84 | 64 | 81 | 92 |
| 2024 | 141 | |||||||||||
| - = No Data Reported; -- = Not Applicable; NA = Not Available; W = Withheld to avoid disclosure of individual company data. |
| Release Date: 3/29/2024 |
| Next Release Date: 4/30/2024 |