|
Download Data (XLS File) |
|
||||||||
|
||||||||
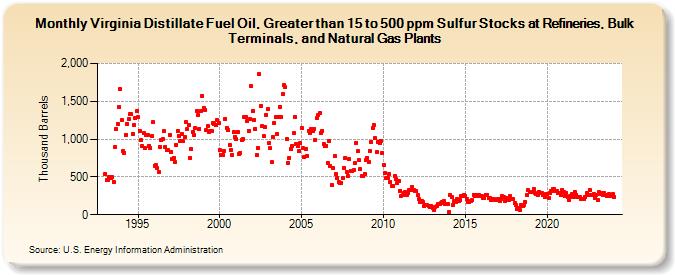
| Virginia Distillate Fuel Oil, Greater than 15 to 500 ppm Sulfur Stocks at Refineries, Bulk Terminals, and Natural Gas Plants (Thousand Barrels) | ||||||||
| Year | Jan | Feb | Mar | Apr | May | Jun | Jul | Aug | Sep | Oct | Nov | Dec |
|---|---|---|---|---|---|---|---|---|---|---|---|---|
| 1993 | 540 | 459 | 455 | 493 | 488 | 499 | 436 | 902 | 1,134 | 1,205 | 1,427 | 1,657 |
| 1994 | 1,251 | 837 | 819 | 1,060 | 1,200 | 1,264 | 1,328 | 1,329 | 1,071 | 1,191 | 1,277 | 1,370 |
| 1995 | 1,291 | 1,109 | 982 | 912 | 1,076 | 877 | 1,051 | 1,049 | 910 | 881 | 1,035 | 1,222 |
| 1996 | 649 | 658 | 615 | 568 | 898 | 984 | 996 | 1,104 | 897 | 851 | 851 | 1,055 |
| 1997 | 832 | 735 | 752 | 700 | 924 | 1,109 | 1,046 | 979 | 1,065 | 974 | 1,034 | 1,222 |
| 1998 | 1,131 | 1,189 | 756 | 868 | 1,099 | 1,050 | 1,148 | 1,374 | 1,325 | 1,140 | 1,372 | 1,575 |
| 1999 | 1,411 | 1,385 | 1,117 | 1,168 | 1,098 | 1,112 | 1,101 | 1,210 | 1,203 | 1,180 | 1,253 | 1,214 |
| 2000 | 850 | 784 | 793 | 839 | 1,270 | 1,151 | 1,122 | 922 | 858 | 790 | 1,092 | 1,033 |
| 2001 | 997 | 1,097 | 803 | 822 | 989 | 1,004 | 1,295 | 1,298 | 1,235 | 1,111 | 1,264 | 1,696 |
| 2002 | 1,370 | 1,259 | 1,140 | 787 | 884 | 1,857 | 1,442 | 1,173 | 1,039 | 1,155 | 1,323 | 1,394 |
| 2003 | 944 | 876 | 694 | 1,029 | 1,214 | 1,296 | 1,069 | 1,294 | 1,425 | 1,288 | 1,601 | 1,715 |
| 2004 | 1,683 | 1,000 | 686 | 752 | 870 | 910 | 1,075 | 1,297 | 929 | 912 | 839 | 944 |
| 2005 | 1,152 | 881 | 758 | 868 | 779 | 1,112 | 1,084 | 1,128 | 1,113 | 1,132 | 993 | 1,278 |
| 2006 | 1,323 | 1,343 | 1,078 | 1,112 | 938 | 903 | 914 | 683 | 979 | 646 | 390 | 616 |
| 2007 | 773 | 532 | 480 | 432 | 417 | 419 | 481 | 617 | 754 | 570 | 509 | 733 |
| 2008 | 583 | 584 | 589 | 679 | 953 | 839 | 719 | 600 | 511 | 508 | 541 | 717 |
| 2009 | 752 | 696 | 846 | 968 | 1,148 | 1,181 | 1,010 | 834 | 967 | 949 | 972 | 815 |
| 2010 | 660 | 547 | 483 | 482 | 540 | 434 | 382 | 385 | 506 | 477 | 420 | 451 |
| 2011 | 317 | 254 | 256 | 291 | 299 | 259 | 288 | 331 | 326 | 364 | 329 | 315 |
| 2012 | 309 | 255 | 203 | 164 | 182 | 166 | 110 | 131 | 125 | 118 | 104 | 117 |
| 2013 | 84 | 66 | 106 | 113 | 146 | 140 | 150 | 167 | 179 | 145 | 146 | 145 |
| 2014 | 32 | 256 | 233 | 133 | 184 | 174 | 210 | 186 | 198 | 246 | 245 | 266 |
| 2015 | 245 | 202 | 170 | 167 | 184 | 194 | 266 | 244 | 255 | 244 | 257 | 243 |
| 2016 | 241 | 223 | 220 | 260 | 267 | 217 | 221 | 199 | 202 | 203 | 189 | 196 |
| 2017 | 209 | 184 | 209 | 242 | 231 | 183 | 226 | 192 | 200 | 242 | 212 | 207 |
| 2018 | 155 | 129 | 80 | 84 | 60 | 129 | 114 | 130 | 170 | 262 | 322 | 296 |
| 2019 | 296 | 305 | 345 | 285 | 276 | 264 | 307 | 293 | 290 | 260 | 235 | 279 |
| 2020 | 277 | 223 | 286 | 309 | 340 | 335 | 313 | 309 | 285 | 286 | 258 | 328 |
| 2021 | 306 | 243 | 289 | 231 | 198 | 254 | 268 | 232 | 302 | 265 | 240 | 240 |
| 2022 | 228 | 211 | 214 | 208 | 230 | 285 | 257 | 333 | 259 | 258 | 279 | 220 |
| 2023 | 257 | 200 | 294 | 275 | 291 | 266 | 287 | 264 | 253 | 269 | 250 | 247 |
| 2024 | 271 | |||||||||||
| - = No Data Reported; -- = Not Applicable; NA = Not Available; W = Withheld to avoid disclosure of individual company data. |
| Release Date: 3/29/2024 |
| Next Release Date: 4/30/2024 |