|
Download Data (XLS File) |
|
||||||||
|
||||||||
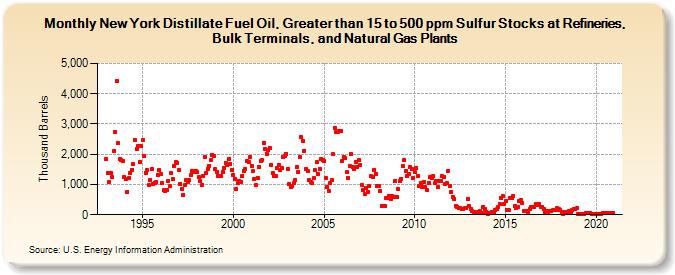
| New York Distillate Fuel Oil, Greater than 15 to 500 ppm Sulfur Stocks at Refineries, Bulk Terminals, and Natural Gas Plants (Thousand Barrels) | ||||||||
| Year | Jan | Feb | Mar | Apr | May | Jun | Jul | Aug | Sep | Oct | Nov | Dec |
|---|---|---|---|---|---|---|---|---|---|---|---|---|
| 1993 | 1,841 | 1,367 | 1,084 | 1,384 | 1,234 | 2,097 | 2,729 | 4,414 | 2,361 | 1,839 | 1,815 | 1,791 |
| 1994 | 1,243 | 1,170 | 766 | 1,207 | 1,393 | 1,489 | 1,664 | 2,470 | 2,167 | 2,272 | 1,747 | 2,269 |
| 1995 | 2,457 | 1,926 | 1,376 | 1,483 | 974 | 1,157 | 1,509 | 1,030 | 1,048 | 1,086 | 1,308 | 1,482 |
| 1996 | 1,331 | 1,039 | 803 | 788 | 814 | 1,131 | 949 | 1,366 | 1,191 | 1,625 | 1,728 | 1,709 |
| 1997 | 1,481 | 1,020 | 865 | 661 | 998 | 1,144 | 1,081 | 1,144 | 1,310 | 1,457 | 1,420 | 1,455 |
| 1998 | 1,408 | 1,232 | 1,108 | 971 | 1,283 | 1,910 | 1,377 | 1,509 | 1,623 | 1,813 | 1,967 | 1,941 |
| 1999 | 1,497 | 1,425 | 1,284 | 1,276 | 1,283 | 1,412 | 1,528 | 1,723 | 1,634 | 1,858 | 1,684 | 1,477 |
| 2000 | 1,313 | 1,183 | 841 | 1,061 | 1,115 | 1,095 | 1,295 | 1,434 | 1,524 | 1,788 | 1,744 | 1,913 |
| 2001 | 1,627 | 1,436 | 1,186 | 991 | 1,230 | 1,579 | 1,790 | 1,809 | 2,372 | 2,173 | 2,018 | 2,124 |
| 2002 | 2,209 | 1,649 | 1,379 | 1,295 | 1,273 | 1,542 | 1,657 | 1,482 | 1,542 | 1,893 | 1,940 | 2,020 |
| 2003 | 1,517 | 1,025 | 920 | 940 | 1,044 | 1,136 | 1,569 | 1,424 | 1,908 | 2,554 | 2,440 | 2,119 |
| 2004 | 1,504 | 1,461 | 1,132 | 1,085 | 1,038 | 1,202 | 1,465 | 1,730 | 1,360 | 1,495 | 1,831 | 1,806 |
| 2005 | 1,771 | 1,227 | 922 | 774 | 1,037 | 1,135 | 1,996 | 2,882 | 2,724 | 2,742 | 2,758 | 2,761 |
| 2006 | 1,778 | 1,908 | 1,875 | 1,398 | 1,230 | 1,596 | 2,008 | 1,562 | 1,518 | 1,736 | 1,583 | 1,800 |
| 2007 | 1,637 | 980 | 813 | 669 | 871 | 747 | 943 | 1,265 | 1,246 | 1,492 | 1,339 | 957 |
| 2008 | 944 | 769 | 293 | 304 | 287 | 552 | 563 | 616 | 536 | 605 | 575 | 1,127 |
| 2009 | 599 | 856 | 1,110 | 1,190 | 1,607 | 1,799 | 1,456 | 1,290 | 1,352 | 1,567 | 1,505 | 1,221 |
| 2010 | 1,417 | 1,551 | 1,281 | 938 | 1,060 | 907 | 1,084 | 915 | 810 | 1,050 | 1,240 | 1,202 |
| 2011 | 1,274 | 1,040 | 1,115 | 908 | 1,105 | 1,110 | 1,279 | 1,252 | 1,016 | 1,037 | 1,450 | 958 |
| 2012 | 756 | 582 | 510 | 300 | 258 | 219 | 215 | 196 | 195 | 220 | 212 | 516 |
| 2013 | 278 | 193 | 122 | 99 | 84 | 50 | 103 | 112 | 70 | 240 | 187 | 105 |
| 2014 | 34 | 44 | 60 | 100 | 63 | 151 | 185 | 240 | 349 | 562 | 615 | 352 |
| 2015 | 461 | 147 | 143 | 539 | 568 | 623 | 279 | 235 | 262 | 465 | 486 | 400 |
| 2016 | 113 | 125 | 108 | 95 | 182 | 241 | 244 | 271 | 361 | 329 | 346 | 271 |
| 2017 | 258 | 189 | 99 | 116 | 95 | 135 | 125 | 145 | 161 | 144 | 230 | 204 |
| 2018 | 148 | 95 | 37 | 94 | 52 | 86 | 110 | 90 | 146 | 191 | 182 | 209 |
| 2019 | 30 | 18 | 9 | 27 | 21 | 59 | 63 | 55 | 48 | 38 | 37 | 31 |
| 2020 | 22 | 10 | 17 | 26 | 65 | 51 | 59 | 65 | 64 | 58 | 57 | 61 |
| - = No Data Reported; -- = Not Applicable; NA = Not Available; W = Withheld to avoid disclosure of individual company data. |
| Release Date: 3/29/2024 |
| Next Release Date: 4/30/2024 |