|
Download Data (XLS File) |
|
||||||||
|
||||||||
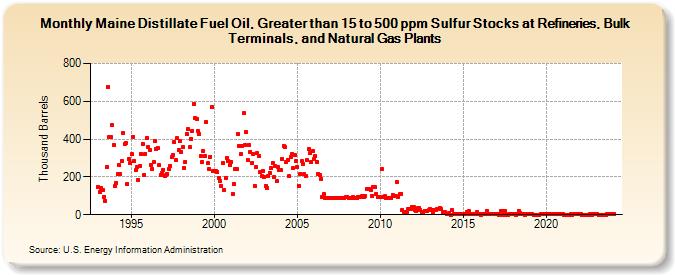
| Maine Distillate Fuel Oil, Greater than 15 to 500 ppm Sulfur Stocks at Refineries, Bulk Terminals, and Natural Gas Plants (Thousand Barrels) | ||||||||
| Year | Jan | Feb | Mar | Apr | May | Jun | Jul | Aug | Sep | Oct | Nov | Dec |
|---|---|---|---|---|---|---|---|---|---|---|---|---|
| 1993 | 147 | 118 | 140 | 131 | 96 | 75 | 254 | 678 | 411 | 409 | 472 | 369 |
| 1994 | 152 | 168 | 213 | 262 | 215 | 285 | 432 | 374 | 380 | 163 | 296 | 271 |
| 1995 | 319 | 413 | 285 | 235 | 251 | 184 | 257 | 321 | 375 | 210 | 322 | 406 |
| 1996 | 356 | 342 | 261 | 241 | 277 | 390 | 349 | 354 | 261 | 209 | 221 | 239 |
| 1997 | 206 | 211 | 217 | 240 | 260 | 304 | 317 | 384 | 288 | 404 | 342 | 390 |
| 1998 | 332 | 357 | 247 | 279 | 427 | 452 | 358 | 402 | 444 | 588 | 510 | 508 |
| 1999 | 441 | 426 | 310 | 278 | 335 | 310 | 491 | 271 | 241 | 307 | 570 | 233 |
| 2000 | 231 | 233 | 227 | 193 | 178 | 152 | 276 | 133 | 196 | 302 | 285 | 261 |
| 2001 | 279 | 110 | 163 | 243 | 240 | 428 | 366 | 321 | 362 | 536 | 371 | 437 |
| 2002 | 291 | 369 | 334 | 273 | 320 | 153 | 250 | 324 | 312 | 226 | 206 | 229 |
| 2003 | 202 | 154 | 142 | 206 | 223 | 245 | 274 | 199 | 258 | 176 | 252 | 235 |
| 2004 | 234 | 295 | 366 | 357 | 278 | 292 | 204 | 304 | 319 | 247 | 315 | 282 |
| 2005 | 252 | 153 | 216 | 282 | 267 | 213 | 204 | 288 | 347 | 326 | 281 | 336 |
| 2006 | 294 | 309 | 281 | 217 | 212 | 191 | 96 | 108 | 89 | 90 | 91 | 90 |
| 2007 | 90 | 89 | 88 | 89 | 88 | 88 | 89 | 88 | 89 | 88 | 88 | 92 |
| 2008 | 93 | 88 | 90 | 89 | 92 | 90 | 89 | 90 | 93 | 93 | 95 | 98 |
| 2009 | 94 | 97 | 135 | 134 | 138 | 129 | 101 | 146 | 144 | 111 | 95 | 96 |
| 2010 | 93 | 241 | 94 | 97 | 87 | 87 | 87 | 87 | 86 | 105 | 100 | 100 |
| 2011 | 174 | 95 | 107 | 111 | 24 | 15 | 14 | 15 | 30 | 28 | 32 | 43 |
| 2012 | 41 | 27 | 18 | 35 | 34 | 24 | 15 | 16 | 22 | 20 | 18 | 23 |
| 2013 | 29 | 26 | 12 | 24 | 25 | 29 | 31 | 37 | 31 | 12 | 12 | 12 |
| 2014 | 3 | 2 | 8 | 1 | 24 | 2 | 3 | 3 | 3 | 3 | 3 | 3 |
| 2015 | 3 | 3 | 2 | 12 | 19 | 2 | 2 | 2 | 3 | 4 | 14 | 3 |
| 2016 | 3 | 1 | 2 | 2 | 2 | 22 | 3 | 2 | 2 | 3 | 3 | 2 |
| 2017 | 3 | 2 | 1 | 18 | 19 | 1 | 21 | 1 | 1 | 3 | 3 | 2 |
| 2018 | 2 | 3 | 1 | 2 | 21 | 11 | 4 | 4 | 3 | 1 | 3 | 4 |
| 2019 | 5 | 3 | 3 | 1 | 1 | 1 | 1 | 1 | 3 | 4 | 4 | 3 |
| 2020 | 4 | 3 | 3 | 5 | 4 | 4 | 5 | 4 | 5 | 5 | 4 | 4 |
| 2021 | 3 | 1 | 1 | 1 | 1 | 2 | 1 | 4 | 4 | 3 | 3 | |
| 2022 | 2 | 2 | 1 | 1 | 1 | 1 | 1 | 2 | 1 | 2 | 3 | |
| 2023 | 2 | 2 | 1 | 1 | 1 | 1 | 1 | 1 | 2 | 2 | 2 | 2 |
| 2024 | 3 | |||||||||||
| - = No Data Reported; -- = Not Applicable; NA = Not Available; W = Withheld to avoid disclosure of individual company data. |
| Release Date: 3/29/2024 |
| Next Release Date: 4/30/2024 |