|
Download Data (XLS File) |
|
||||||||
|
||||||||
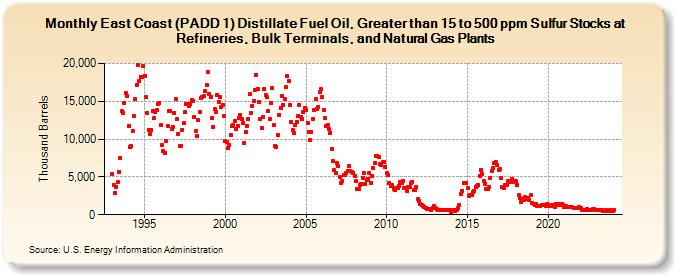
| East Coast (PADD 1) Distillate Fuel Oil, Greater than 15 to 500 ppm Sulfur Stocks at Refineries, Bulk Terminals, and Natural Gas Plants (Thousand Barrels) | ||||||||
| Year | Jan | Feb | Mar | Apr | May | Jun | Jul | Aug | Sep | Oct | Nov | Dec |
|---|---|---|---|---|---|---|---|---|---|---|---|---|
| 1993 | 5,412 | 3,930 | 2,889 | 3,693 | 4,285 | 5,700 | 7,551 | 13,688 | 13,484 | 14,772 | 16,075 | 15,713 |
| 1994 | 11,700 | 8,933 | 9,040 | 11,107 | 13,088 | 15,248 | 17,109 | 19,811 | 17,734 | 18,249 | 18,258 | 19,628 |
| 1995 | 18,408 | 15,560 | 13,405 | 11,268 | 10,687 | 11,239 | 13,700 | 12,782 | 13,571 | 13,816 | 14,707 | 14,714 |
| 1996 | 11,816 | 9,164 | 8,361 | 8,171 | 9,748 | 11,780 | 13,695 | 13,666 | 11,357 | 11,649 | 13,417 | 15,289 |
| 1997 | 12,625 | 10,678 | 9,082 | 9,047 | 11,258 | 12,081 | 13,528 | 14,600 | 14,662 | 14,434 | 14,584 | 15,134 |
| 1998 | 15,022 | 12,954 | 11,055 | 10,436 | 12,489 | 13,647 | 15,442 | 15,511 | 15,660 | 16,310 | 17,194 | 18,825 |
| 1999 | 15,939 | 15,553 | 12,777 | 11,662 | 13,945 | 13,646 | 15,811 | 14,970 | 15,545 | 14,249 | 14,504 | 12,991 |
| 2000 | 9,778 | 9,576 | 8,849 | 9,230 | 10,505 | 11,681 | 11,817 | 12,390 | 11,370 | 11,769 | 12,754 | 13,142 |
| 2001 | 12,613 | 12,179 | 9,516 | 10,965 | 11,729 | 12,720 | 15,930 | 13,509 | 14,355 | 15,015 | 16,504 | 18,501 |
| 2002 | 16,687 | 14,945 | 12,710 | 11,495 | 12,899 | 16,589 | 15,828 | 15,551 | 13,694 | 12,598 | 14,735 | 16,791 |
| 2003 | 11,819 | 9,122 | 8,962 | 10,544 | 13,211 | 14,147 | 15,749 | 14,554 | 15,333 | 16,838 | 18,303 | 17,732 |
| 2004 | 14,567 | 12,299 | 11,173 | 10,745 | 11,808 | 12,304 | 13,002 | 14,547 | 12,988 | 12,703 | 13,585 | 14,150 |
| 2005 | 13,857 | 12,182 | 10,945 | 9,866 | 10,894 | 12,631 | 13,880 | 15,269 | 13,923 | 14,262 | 16,165 | 16,635 |
| 2006 | 15,551 | 13,910 | 12,836 | 11,780 | 11,879 | 11,389 | 10,810 | 8,746 | 7,047 | 5,870 | 5,465 | 6,776 |
| 2007 | 6,389 | 4,984 | 4,259 | 4,491 | 5,196 | 5,311 | 5,538 | 5,838 | 6,460 | 5,725 | 5,595 | 5,513 |
| 2008 | 5,144 | 4,396 | 3,396 | 3,344 | 3,929 | 4,024 | 4,916 | 5,572 | 4,036 | 4,568 | 4,770 | 5,571 |
| 2009 | 4,197 | 5,178 | 6,190 | 6,836 | 7,763 | 7,730 | 7,638 | 6,706 | 6,581 | 6,938 | 6,935 | 6,308 |
| 2010 | 5,483 | 5,216 | 4,257 | 3,761 | 3,888 | 3,422 | 3,312 | 3,476 | 3,546 | 3,861 | 4,311 | 4,194 |
| 2011 | 4,520 | 3,587 | 3,544 | 3,096 | 3,692 | 3,689 | 4,189 | 4,380 | 3,264 | 3,209 | 3,642 | 2,027 |
| 2012 | 1,761 | 1,453 | 1,242 | 1,177 | 1,065 | 871 | 799 | 767 | 746 | 642 | 844 | 1,137 |
| 2013 | 921 | 728 | 663 | 603 | 622 | 602 | 566 | 680 | 658 | 687 | 641 | 587 |
| 2014 | 322 | 581 | 615 | 548 | 628 | 839 | 1,342 | 2,743 | 3,187 | 4,156 | 4,161 | 4,201 |
| 2015 | 3,598 | 2,506 | 2,555 | 2,618 | 2,940 | 3,176 | 3,706 | 3,854 | 3,961 | 5,131 | 5,965 | 5,364 |
| 2016 | 4,498 | 4,124 | 3,402 | 3,414 | 3,679 | 4,866 | 5,756 | 6,131 | 6,816 | 6,941 | 6,554 | 5,961 |
| 2017 | 6,014 | 4,888 | 3,628 | 3,572 | 3,947 | 3,987 | 4,479 | 4,274 | 4,396 | 4,683 | 4,372 | 4,419 |
| 2018 | 4,446 | 3,952 | 2,565 | 2,233 | 1,635 | 2,130 | 1,915 | 2,312 | 2,128 | 2,238 | 2,000 | 2,593 |
| 2019 | 1,589 | 1,367 | 1,337 | 1,390 | 1,185 | 1,169 | 1,097 | 1,292 | 1,251 | 1,327 | 1,162 | 1,394 |
| 2020 | 1,271 | 1,141 | 1,217 | 1,298 | 1,112 | 1,072 | 1,435 | 1,408 | 1,291 | 1,437 | 1,453 | 1,346 |
| 2021 | 1,055 | 1,154 | 1,014 | 960 | 957 | 1,004 | 996 | 896 | 876 | 942 | 871 | 1,032 |
| 2022 | 838 | 639 | 649 | 574 | 576 | 748 | 624 | 617 | 674 | 784 | 711 | 591 |
| 2023 | 598 | 580 | 623 | 589 | 637 | 512 | 534 | 568 | 508 | 530 | 603 | 552 |
| 2024 | 536 | 604 | 621 | 556 | 646 | 605 | ||||||
| - = No Data Reported; -- = Not Applicable; NA = Not Available; W = Withheld to avoid disclosure of individual company data. |
| Release Date: 8/30/2024 |
| Next Release Date: 9/30/2024 |