|
Download Data (XLS File) |
|
||||||||
|
||||||||
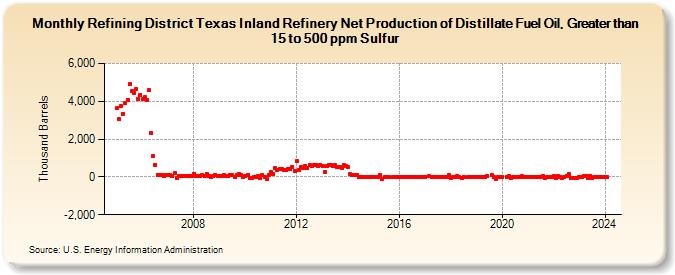
| Refining District Texas Inland Refinery Net Production of Distillate Fuel Oil, Greater than 15 to 500 ppm Sulfur (Thousand Barrels) | ||||||||
| Year | Jan | Feb | Mar | Apr | May | Jun | Jul | Aug | Sep | Oct | Nov | Dec |
|---|---|---|---|---|---|---|---|---|---|---|---|---|
| 2005 | 3,626 | 3,047 | 3,731 | 3,339 | 3,912 | 4,071 | 4,892 | 4,520 | 4,438 | 4,659 | 4,142 | 4,335 |
| 2006 | 4,101 | 4,204 | 4,089 | 4,571 | 2,314 | 1,081 | 639 | 113 | 103 | 113 | 43 | 114 |
| 2007 | 102 | 90 | 73 | 196 | -39 | 50 | 71 | 50 | 54 | 70 | 65 | 73 |
| 2008 | 178 | 73 | 74 | 66 | 84 | 73 | 174 | 74 | 20 | 70 | 77 | 74 |
| 2009 | 27 | 61 | 84 | 55 | 38 | 117 | 76 | 9 | 79 | 145 | 107 | -24 |
| 2010 | 34 | 124 | -45 | -35 | 4 | -30 | 30 | -40 | 94 | 13 | -112 | 78 |
| 2011 | 268 | 140 | 471 | 390 | 405 | 438 | 362 | 387 | 398 | 399 | 541 | 314 |
| 2012 | 844 | 388 | 515 | 497 | 580 | 453 | 652 | 557 | 640 | 647 | 580 | 639 |
| 2013 | 584 | 236 | 573 | 616 | 639 | 564 | 621 | 532 | 519 | 494 | 604 | 577 |
| 2014 | 515 | 138 | 81 | 113 | 89 | 20 | -1 | -1 | -15 | 12 | -15 | 1 |
| 2015 | -1 | 2 | 11 | 112 | -100 | -12 | -10 | 7 | 1 | 15 | -23 | |
| 2016 | -3 | 12 | -3 | 4 | 2 | -7 | -7 | 7 | -5 | 2 | 9 | -6 |
| 2017 | -5 | 25 | -9 | 2 | -8 | -3 | 7 | 1 | 14 | -22 | 79 | |
| 2018 | -77 | -4 | 4 | 55 | -21 | -38 | 10 | -12 | -3 | 21 | 5 | |
| 2019 | -24 | -3 | 6 | 20 | -6 | 27 | 89 | -26 | -102 | -5 | 21 | |
| 2020 | -9 | 7 | 23 | -35 | 6 | 17 | -28 | -4 | 23 | -21 | 17 | |
| 2021 | -20 | 14 | -12 | 8 | -8 | 15 | -15 | 53 | -43 | -5 | 12 | -7 |
| 2022 | 39 | -43 | 24 | 15 | -34 | -7 | 56 | 139 | -46 | -50 | -44 | -57 |
| 2023 | 2 | 2 | 26 | 63 | -71 | 48 | -63 | 10 | -19 | 6 | -1 | -1 |
| 2024 | -3 | |||||||||||
| - = No Data Reported; -- = Not Applicable; NA = Not Available; W = Withheld to avoid disclosure of individual company data. |
| Release Date: 3/29/2024 |
| Next Release Date: 4/30/2024 |