|
Download Data (XLS File) |
|
||||||||
|
||||||||
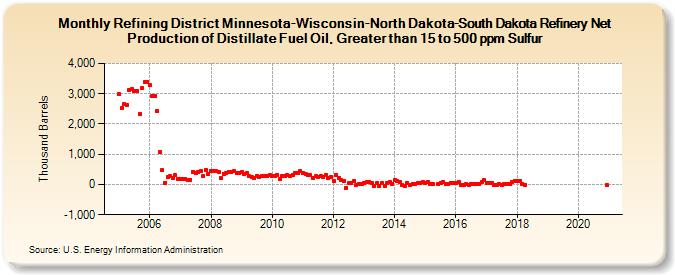
| Refining District Minnesota-Wisconsin-North Dakota-South Dakota Refinery Net Production of Distillate Fuel Oil, Greater than 15 to 500 ppm Sulfur (Thousand Barrels) | ||||||||
| Year | Jan | Feb | Mar | Apr | May | Jun | Jul | Aug | Sep | Oct | Nov | Dec |
|---|---|---|---|---|---|---|---|---|---|---|---|---|
| 2005 | 2,977 | 2,527 | 2,663 | 2,612 | 3,119 | 3,145 | 3,079 | 3,104 | 2,343 | 3,196 | 3,385 | 3,400 |
| 2006 | 3,276 | 2,936 | 2,919 | 2,431 | 1,062 | 464 | 58 | 243 | 289 | 217 | 302 | 194 |
| 2007 | 171 | 191 | 188 | 157 | 157 | 421 | 363 | 400 | 436 | 275 | 485 | 348 |
| 2008 | 459 | 450 | 434 | 414 | 204 | 356 | 395 | 421 | 421 | 430 | 387 | 377 |
| 2009 | 411 | 360 | 370 | 279 | 240 | 218 | 296 | 253 | 272 | 268 | 290 | 317 |
| 2010 | 288 | 296 | 319 | 175 | 269 | 273 | 304 | 276 | 305 | 376 | 391 | 430 |
| 2011 | 380 | 362 | 304 | 309 | 223 | 266 | 235 | 284 | 260 | 303 | 199 | 259 |
| 2012 | 127 | 308 | 211 | 145 | 100 | -102 | 51 | 40 | 107 | -9 | -1 | 8 |
| 2013 | 36 | 79 | 92 | 46 | -38 | 33 | -66 | 49 | -37 | 57 | 91 | 32 |
| 2014 | 151 | 110 | 93 | -13 | -42 | 49 | -10 | 21 | 25 | 41 | 54 | 98 |
| 2015 | 57 | 82 | 11 | 12 | 8 | 33 | 68 | 8 | 22 | 57 | 39 | |
| 2016 | 54 | 77 | -12 | -9 | 2 | -17 | -1 | 21 | 31 | 12 | 72 | 137 |
| 2017 | 45 | 65 | 54 | -28 | -26 | 9 | -16 | 2 | 25 | 19 | 83 | 111 |
| 2018 | 123 | 107 | 31 | -2 | ||||||||
| 2020 | -8 | |||||||||||
| - = No Data Reported; -- = Not Applicable; NA = Not Available; W = Withheld to avoid disclosure of individual company data. |
| Release Date: 3/29/2024 |
| Next Release Date: 4/30/2024 |