|
Download Data (XLS File) |
|
||||||||
|
||||||||
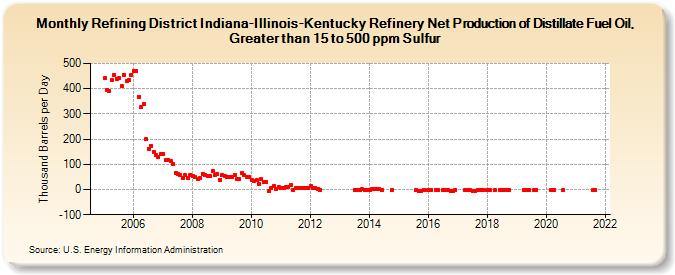
| Refining District Indiana-Illinois-Kentucky Refinery Net Production of Distillate Fuel Oil, Greater than 15 to 500 ppm Sulfur (Thousand Barrels per Day) | ||||||||
| Year | Jan | Feb | Mar | Apr | May | Jun | Jul | Aug | Sep | Oct | Nov | Dec |
|---|---|---|---|---|---|---|---|---|---|---|---|---|
| 2005 | 441 | 395 | 390 | 433 | 455 | 440 | 441 | 411 | 456 | 430 | 436 | 456 |
| 2006 | 471 | 470 | 368 | 327 | 340 | 199 | 162 | 174 | 150 | 137 | 127 | 139 |
| 2007 | 142 | 117 | 116 | 115 | 102 | 67 | 62 | 56 | 44 | 56 | 44 | 59 |
| 2008 | 55 | 49 | 41 | 46 | 63 | 59 | 52 | 53 | 73 | 58 | 62 | 39 |
| 2009 | 57 | 52 | 48 | 51 | 49 | 58 | 42 | 42 | 64 | 56 | 51 | 49 |
| 2010 | 37 | 35 | 37 | 23 | 40 | 28 | 28 | -5 | 5 | 13 | 4 | 8 |
| 2011 | 7 | 7 | 9 | 10 | 19 | 0 | 5 | 5 | 5 | 5 | 6 | 6 |
| 2012 | 13 | 6 | 5 | 2 | 0 | |||||||
| 2013 | 0 | 0 | 0 | 1 | 0 | 0 | ||||||
| 2014 | 0 | 1 | 1 | 1 | 1 | 0 | -2 | |||||
| 2015 | -3 | -4 | -5 | -1 | ||||||||
| 2016 | -2 | -1 | -1 | -1 | -1 | -2 | -3 | -5 | -5 | -1 | ||
| 2017 | -2 | -3 | -3 | -6 | -6 | -2 | -2 | -2 | ||||
| 2018 | -1 | -1 | -2 | -1 | -2 | -2 | -2 | 0 | ||||
| 2019 | 0 | -2 | -1 | -1 | -1 | |||||||
| 2020 | -1 | 0 | -1 | |||||||||
| 2021 | -2 | -1 | ||||||||||
| - = No Data Reported; -- = Not Applicable; NA = Not Available; W = Withheld to avoid disclosure of individual company data. |
| Release Date: 4/30/2024 |
| Next Release Date: 5/31/2024 |