|
Download Data (XLS File) |
|
||||||||
|
||||||||
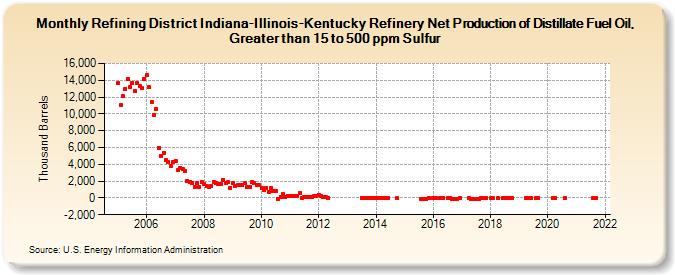
| Refining District Indiana-Illinois-Kentucky Refinery Net Production of Distillate Fuel Oil, Greater than 15 to 500 ppm Sulfur (Thousand Barrels) | ||||||||
| Year | Jan | Feb | Mar | Apr | May | Jun | Jul | Aug | Sep | Oct | Nov | Dec |
|---|---|---|---|---|---|---|---|---|---|---|---|---|
| 2005 | 13,682 | 11,050 | 12,097 | 12,981 | 14,111 | 13,197 | 13,676 | 12,736 | 13,674 | 13,335 | 13,075 | 14,133 |
| 2006 | 14,603 | 13,153 | 11,421 | 9,822 | 10,539 | 5,977 | 5,013 | 5,391 | 4,501 | 4,242 | 3,819 | 4,300 |
| 2007 | 4,397 | 3,263 | 3,611 | 3,463 | 3,163 | 2,013 | 1,930 | 1,729 | 1,329 | 1,722 | 1,316 | 1,839 |
| 2008 | 1,698 | 1,414 | 1,264 | 1,375 | 1,943 | 1,778 | 1,621 | 1,642 | 2,185 | 1,808 | 1,846 | 1,208 |
| 2009 | 1,777 | 1,442 | 1,499 | 1,531 | 1,525 | 1,734 | 1,291 | 1,312 | 1,916 | 1,738 | 1,536 | 1,522 |
| 2010 | 1,133 | 978 | 1,145 | 676 | 1,238 | 850 | 857 | -164 | 155 | 413 | 116 | 237 |
| 2011 | 230 | 199 | 266 | 285 | 597 | -8 | 154 | 150 | 159 | 142 | 172 | 198 |
| 2012 | 393 | 173 | 167 | 59 | 7 | |||||||
| 2013 | 12 | 10 | 5 | 22 | 5 | 2 | ||||||
| 2014 | 11 | 19 | 18 | 16 | 18 | 1 | -50 | |||||
| 2015 | -90 | -120 | -151 | -31 | ||||||||
| 2016 | -60 | -15 | -30 | -20 | -35 | -47 | -81 | -157 | -150 | -35 | ||
| 2017 | -46 | -104 | -103 | -176 | -182 | -60 | -60 | -60 | ||||
| 2018 | -20 | -30 | -60 | -19 | -55 | -69 | -48 | -2 | ||||
| 2019 | -9 | -67 | -23 | -46 | -23 | |||||||
| 2020 | -37 | -2 | -25 | |||||||||
| 2021 | -61 | -30 | ||||||||||
| - = No Data Reported; -- = Not Applicable; NA = Not Available; W = Withheld to avoid disclosure of individual company data. |
| Release Date: 3/29/2024 |
| Next Release Date: 4/30/2024 |