|
Download Data (XLS File) |
|
||||||||
|
||||||||
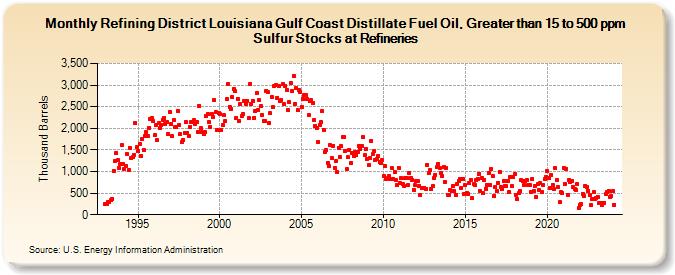
| Refining District Louisiana Gulf Coast Distillate Fuel Oil, Greater than 15 to 500 ppm Sulfur Stocks at Refineries (Thousand Barrels) | ||||||||
| Year | Jan | Feb | Mar | Apr | May | Jun | Jul | Aug | Sep | Oct | Nov | Dec |
|---|---|---|---|---|---|---|---|---|---|---|---|---|
| 1993 | 259 | 243 | 301 | 295 | 330 | 369 | 1,019 | 1,246 | 1,433 | 1,261 | 1,073 | 1,168 |
| 1994 | 1,607 | 1,164 | 1,068 | 1,129 | 1,401 | 1,041 | 1,555 | 1,304 | 1,334 | 1,393 | 2,123 | 1,560 |
| 1995 | 1,465 | 1,647 | 1,359 | 1,753 | 1,490 | 1,828 | 1,910 | 1,820 | 2,017 | 2,215 | 2,240 | 2,174 |
| 1996 | 1,834 | 2,069 | 1,728 | 2,112 | 2,013 | 2,084 | 2,200 | 2,242 | 2,109 | 2,153 | 1,874 | 2,386 |
| 1997 | 2,104 | 1,818 | 2,184 | 2,020 | 2,019 | 2,401 | 2,078 | 1,860 | 1,682 | 1,734 | 1,896 | 2,145 |
| 1998 | 1,895 | 1,828 | 2,034 | 2,157 | 2,152 | 2,182 | 2,091 | 2,141 | 1,917 | 2,520 | 1,997 | 1,919 |
| 1999 | 1,871 | 1,907 | 2,295 | 2,322 | 2,136 | 2,034 | 2,334 | 2,266 | 2,645 | 2,380 | 1,963 | 2,353 |
| 2000 | 2,327 | 1,949 | 2,073 | 2,300 | 2,173 | 2,674 | 3,030 | 2,488 | 2,445 | 2,730 | 2,914 | 2,853 |
| 2001 | 2,249 | 2,678 | 2,167 | 2,555 | 2,280 | 2,340 | 2,630 | 2,570 | 2,641 | 2,228 | 3,020 | 2,573 |
| 2002 | 2,632 | 2,248 | 2,389 | 2,810 | 2,430 | 2,647 | 2,513 | 2,315 | 2,175 | 2,176 | 2,874 | 2,848 |
| 2003 | 2,121 | 2,344 | 2,730 | 2,486 | 2,983 | 3,000 | 2,709 | 2,983 | 2,626 | 2,653 | 3,029 | 2,553 |
| 2004 | 2,985 | 2,891 | 2,430 | 2,603 | 3,052 | 2,855 | 3,215 | 2,573 | 2,932 | 2,421 | 2,885 | 2,849 |
| 2005 | 2,497 | 2,673 | 2,766 | 2,766 | 2,688 | 2,309 | 2,625 | 2,644 | 2,595 | 2,197 | 2,051 | 1,996 |
| 2006 | 1,693 | 2,070 | 2,139 | 2,392 | 1,967 | 1,461 | 1,500 | 1,204 | 1,120 | 1,602 | 1,311 | 1,600 |
| 2007 | 1,087 | 1,241 | 977 | 1,552 | 1,345 | 1,587 | 1,789 | 1,792 | 1,483 | 1,053 | 1,333 | 1,496 |
| 2008 | 1,197 | 1,425 | 1,358 | 1,445 | 1,371 | 1,462 | 1,590 | 1,522 | 1,579 | 1,794 | 1,381 | 1,520 |
| 2009 | 1,299 | 1,143 | 1,317 | 1,715 | 1,398 | 1,467 | 1,270 | 1,295 | 1,367 | 1,214 | 1,200 | 1,265 |
| 2010 | 894 | 1,117 | 831 | 848 | 896 | 827 | 1,080 | 827 | 994 | 800 | 680 | 1,088 |
| 2011 | 743 | 839 | 721 | 669 | 854 | 851 | 686 | 973 | 859 | 813 | 581 | 683 |
| 2012 | 784 | 772 | 669 | 451 | 610 | 609 | 614 | 606 | 1,157 | 966 | 1,027 | 595 |
| 2013 | 668 | 856 | 923 | 1,107 | 1,184 | 1,083 | 965 | 902 | 1,109 | 764 | 1,081 | 462 |
| 2014 | 447 | 574 | 538 | 671 | 546 | 448 | 717 | 779 | 836 | 613 | 831 | 490 |
| 2015 | 679 | 501 | 486 | 732 | 806 | 376 | 705 | 692 | 808 | 834 | 945 | 548 |
| 2016 | 852 | 491 | 806 | 605 | 681 | 957 | 692 | 1,057 | 893 | 436 | 643 | 543 |
| 2017 | 735 | 986 | 641 | 606 | 775 | 674 | 657 | 786 | 524 | 869 | 655 | 873 |
| 2018 | 937 | 467 | 363 | 496 | 540 | 793 | 776 | 688 | 787 | 792 | 692 | 689 |
| 2019 | 518 | 827 | 556 | 658 | 413 | 705 | 582 | 728 | 531 | 685 | 816 | 874 |
| 2020 | 1,006 | 841 | 608 | 924 | 690 | 584 | 1,070 | 800 | 635 | 294 | 523 | 502 |
| 2021 | 1,084 | 720 | 1,064 | 460 | 812 | 759 | 769 | 648 | 593 | 570 | 710 | 160 |
| 2022 | 236 | 239 | 483 | 430 | 668 | 638 | 555 | 455 | 224 | 372 | 523 | 372 |
| 2023 | 392 | 405 | 266 | 275 | 218 | 281 | 280 | 473 | 522 | 556 | 412 | 431 |
| 2024 | 540 | 235 | 138 | 416 | 430 | 301 | ||||||
| - = No Data Reported; -- = Not Applicable; NA = Not Available; W = Withheld to avoid disclosure of individual company data. |
| Release Date: 8/30/2024 |
| Next Release Date: 9/30/2024 |