|
Download Data (XLS File) |
|
||||||||
|
||||||||
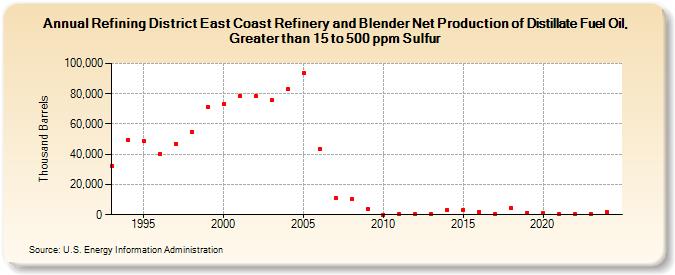
| Refining District East Coast Refinery and Blender Net Production of Distillate Fuel Oil, Greater than 15 to 500 ppm Sulfur (Thousand Barrels) | ||||||||
| Decade | Year-0 | Year-1 | Year-2 | Year-3 | Year-4 | Year-5 | Year-6 | Year-7 | Year-8 | Year-9 |
|---|---|---|---|---|---|---|---|---|---|---|
| 1990's | 32,277 | 49,388 | 48,980 | 40,036 | 46,952 | 54,727 | 71,281 | |||
| 2000's | 73,127 | 78,761 | 78,279 | 75,697 | 83,012 | 93,736 | 43,584 | 11,158 | 10,211 | 3,747 |
| 2010's | 23 | 251 | 187 | 415 | 3,201 | 3,401 | 1,971 | 309 | 4,653 | 1,453 |
| 2020's | 891 | 173 | 188 | 519 |
| - = No Data Reported; -- = Not Applicable; NA = Not Available; W = Withheld to avoid disclosure of individual company data. |
| Release Date: 3/29/2024 |
| Next Release Date: 8/30/2024 |