|
Download Data (XLS File) |
|
||||||||
|
||||||||
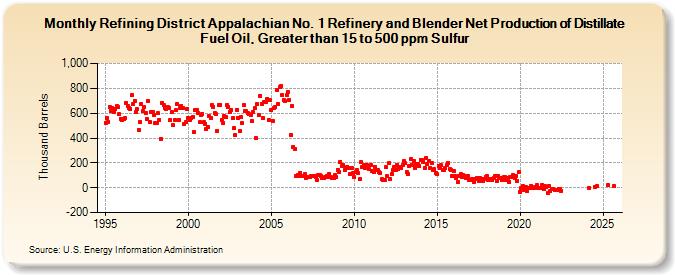
| Refining District Appalachian No. 1 Refinery and Blender Net Production of Distillate Fuel Oil, Greater than 15 to 500 ppm Sulfur (Thousand Barrels) | ||||||||
| Year | Jan | Feb | Mar | Apr | May | Jun | Jul | Aug | Sep | Oct | Nov | Dec |
|---|---|---|---|---|---|---|---|---|---|---|---|---|
| 1995 | 521 | 565 | 532 | 650 | 621 | 642 | 608 | 636 | 655 | 648 | 591 | 557 |
| 1996 | 546 | 551 | 561 | 682 | 660 | 643 | 637 | 743 | 674 | 699 | 607 | 632 |
| 1997 | 466 | 526 | 675 | 616 | 648 | 600 | 552 | 698 | 526 | 613 | 607 | 584 |
| 1998 | 522 | 524 | 598 | 548 | 393 | 680 | 667 | 645 | 635 | 649 | 640 | 547 |
| 1999 | 609 | 504 | 546 | 625 | 671 | 547 | 644 | 658 | 638 | 512 | 526 | 636 |
| 2000 | 558 | 544 | 560 | 569 | 447 | 626 | 626 | 605 | 526 | 589 | 595 | 525 |
| 2001 | 512 | 471 | 485 | 574 | 560 | 664 | 650 | 603 | 591 | 457 | 669 | 667 |
| 2002 | 544 | 522 | 578 | 570 | 664 | 650 | 608 | 624 | 565 | 477 | 424 | 629 |
| 2003 | 565 | 454 | 571 | 518 | 665 | 619 | 614 | 598 | 591 | 589 | 539 | 611 |
| 2004 | 641 | 400 | 673 | 584 | 740 | 676 | 561 | 689 | 687 | 718 | 546 | 703 |
| 2005 | 622 | 539 | 645 | 649 | 790 | 675 | 811 | 819 | 743 | 704 | 697 | 746 |
| 2006 | 768 | 708 | 425 | 658 | 326 | 313 | 91 | 103 | 94 | 121 | 94 | 98 |
| 2007 | 109 | 76 | 83 | 87 | 88 | 92 | 91 | 97 | 86 | 59 | 99 | 106 |
| 2008 | 97 | 81 | 80 | 83 | 98 | 90 | 109 | 87 | 82 | 78 | 99 | 84 |
| 2009 | 145 | 124 | 208 | 176 | 184 | 143 | 161 | 169 | 162 | 112 | 159 | 116 |
| 2010 | 88 | 127 | 145 | 119 | 67 | 204 | 166 | 183 | 161 | 179 | 167 | 150 |
| 2011 | 180 | 134 | 124 | 170 | 140 | 142 | 124 | 119 | 67 | 64 | 63 | 163 |
| 2012 | 91 | 198 | 70 | 108 | 141 | 168 | 139 | 182 | 153 | 166 | 161 | 180 |
| 2013 | 213 | 196 | 126 | 109 | 173 | 230 | 181 | 216 | 162 | 189 | 190 | 178 |
| 2014 | 225 | 227 | 211 | 161 | 240 | 189 | 215 | 157 | 198 | 141 | 149 | 118 |
| 2015 | 107 | 176 | 155 | 180 | 141 | 144 | 160 | 179 | 199 | 148 | 144 | 92 |
| 2016 | 138 | 94 | 78 | 42 | 97 | 107 | 90 | 102 | 93 | 77 | 92 | 64 |
| 2017 | 61 | 67 | 74 | 49 | 69 | 81 | 58 | 81 | 72 | 58 | 74 | 89 |
| 2018 | 91 | 66 | 68 | 67 | 65 | 77 | 95 | 58 | 97 | 79 | 79 | 62 |
| 2019 | 84 | 83 | 65 | 81 | 50 | 85 | 84 | 104 | 82 | 95 | 51 | 124 |
| 2020 | -31 | 0 | 12 | -17 | 6 | -27 | -1 | -1 | 17 | -3 | -3 | 3 |
| 2021 | 18 | -1 | -4 | -4 | 25 | -9 | 11 | 6 | -41 | 10 | -30 | -12 |
| 2022 | -14 | -20 | -15 | -7 | -14 | -23 | ||||||
| - = No Data Reported; -- = Not Applicable; NA = Not Available; W = Withheld to avoid disclosure of individual company data. |
| Release Date: 3/29/2024 |
| Next Release Date: 4/30/2024 |