|
Download Data (XLS File) |
|
||||||||
|
||||||||
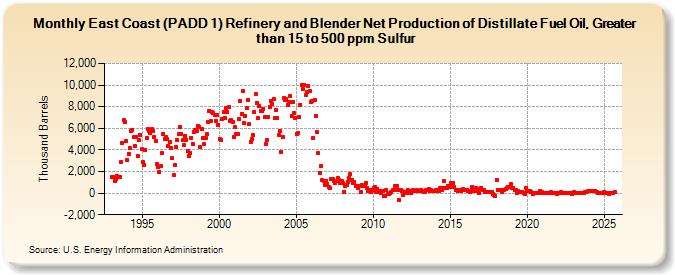
| East Coast (PADD 1) Refinery and Blender Net Production of Distillate Fuel Oil, Greater than 15 to 500 ppm Sulfur (Thousand Barrels) | ||||||||
| Year | Jan | Feb | Mar | Apr | May | Jun | Jul | Aug | Sep | Oct | Nov | Dec |
|---|---|---|---|---|---|---|---|---|---|---|---|---|
| 1993 | 1,511 | 1,507 | 1,102 | 1,276 | 1,613 | 1,487 | 1,526 | 2,855 | 4,650 | 6,763 | 6,628 | 4,844 |
| 1994 | 3,070 | 3,652 | 4,137 | 5,737 | 5,866 | 5,165 | 4,401 | 5,192 | 3,468 | 4,874 | 5,403 | 4,048 |
| 1995 | 2,884 | 2,621 | 4,018 | 5,093 | 5,940 | 5,717 | 5,603 | 5,909 | 5,714 | 5,190 | 4,820 | 2,697 |
| 1996 | 2,382 | 1,954 | 2,467 | 3,709 | 5,505 | 5,027 | 5,172 | 4,973 | 4,339 | 4,760 | 4,174 | 3,209 |
| 1997 | 1,708 | 2,635 | 4,314 | 4,901 | 5,434 | 6,152 | 5,426 | 4,900 | 4,455 | 5,308 | 4,962 | 3,868 |
| 1998 | 3,443 | 3,731 | 5,130 | 4,584 | 5,672 | 5,878 | 5,737 | 6,258 | 6,118 | 4,236 | 5,896 | 5,092 |
| 1999 | 4,534 | 5,106 | 5,440 | 6,589 | 7,613 | 6,718 | 7,504 | 7,389 | 7,249 | 6,672 | 7,271 | 6,312 |
| 2000 | 4,975 | 4,955 | 6,891 | 7,482 | 6,986 | 7,855 | 7,495 | 7,936 | 6,709 | 6,811 | 6,591 | 5,211 |
| 2001 | 6,095 | 5,460 | 5,464 | 6,884 | 8,546 | 7,335 | 9,469 | 6,447 | 7,120 | 7,854 | 8,622 | 6,368 |
| 2002 | 4,754 | 5,019 | 5,350 | 7,503 | 9,132 | 8,349 | 6,963 | 8,026 | 7,636 | 7,586 | 7,816 | 7,000 |
| 2003 | 4,531 | 4,919 | 7,032 | 8,013 | 8,571 | 8,289 | 8,699 | 6,933 | 7,665 | 6,912 | 5,336 | 5,731 |
| 2004 | 3,774 | 5,192 | 8,833 | 8,594 | 8,713 | 8,159 | 8,392 | 8,980 | 7,134 | 8,480 | 7,431 | 6,948 |
| 2005 | 5,518 | 5,575 | 7,052 | 8,183 | 10,007 | 9,630 | 10,031 | 9,047 | 9,326 | 9,930 | 9,430 | 8,447 |
| 2006 | 8,511 | 5,071 | 8,624 | 7,118 | 5,675 | 3,678 | 1,889 | 2,537 | 1,184 | 1,157 | 788 | 1,151 |
| 2007 | 815 | 587 | 454 | 1,337 | 1,299 | 1,093 | 937 | 1,085 | 1,407 | 1,193 | 944 | 1,080 |
| 2008 | 901 | 145 | 612 | 788 | 1,068 | 1,421 | 1,758 | 1,228 | 961 | 1,025 | 702 | 670 |
| 2009 | 474 | 669 | 77 | 789 | 625 | 663 | 936 | 513 | 165 | 319 | 125 | 251 |
| 2010 | 435 | 585 | 140 | 413 | 149 | 155 | 43 | 182 | -249 | -300 | 282 | -56 |
| 2011 | -61 | -32 | 146 | 257 | 317 | 633 | 621 | 294 | -656 | 254 | 165 | -197 |
| 2012 | 109 | -6 | 48 | 279 | 216 | 7 | 180 | 312 | 165 | 179 | 245 | 210 |
| 2013 | 239 | 254 | 193 | 124 | 59 | 260 | 271 | 350 | 189 | 254 | 199 | 186 |
| 2014 | 210 | 250 | 263 | 193 | 501 | 253 | 485 | 1,095 | 510 | 437 | 687 | 548 |
| 2015 | 926 | 543 | 958 | 606 | 265 | 315 | 219 | 242 | 212 | 306 | 359 | 275 |
| 2016 | 267 | 255 | 150 | 142 | 194 | 594 | 174 | 213 | 479 | 201 | 23 | 353 |
| 2017 | 516 | 328 | 262 | 100 | 78 | 120 | 76 | 92 | 114 | -112 | -188 | -244 |
| 2018 | 1,241 | 285 | 242 | 323 | 102 | 297 | 318 | 379 | 456 | 592 | 524 | 798 |
| 2019 | 474 | 452 | 258 | 274 | 50 | 166 | 110 | 133 | 114 | -7 | -60 | 477 |
| 2020 | 170 | 187 | 158 | 124 | -105 | -2 | -16 | 28 | 31 | 55 | 152 | 64 |
| 2021 | 27 | -1 | 47 | 30 | 3 | 23 | 71 | -14 | 9 | -15 | 25 | -63 |
| 2022 | 4 | -13 | 76 | -2 | -18 | -29 | -15 | 17 | 41 | 30 | 41 | -37 |
| 2023 | 73 | -16 | 10 | 32 | 14 | 16 | 17 | 17 | 15 | 67 | 106 | 168 |
| 2024 | 161 | 190 | 178 | 218 | 199 | 201 | ||||||
| - = No Data Reported; -- = Not Applicable; NA = Not Available; W = Withheld to avoid disclosure of individual company data. |
| Release Date: 8/30/2024 |
| Next Release Date: 9/30/2024 |