|
Download Data (XLS File) |
|
||||||||
|
||||||||
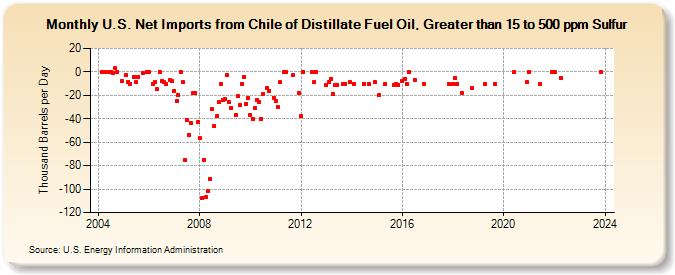
| U.S. Net Imports from Chile of Distillate Fuel Oil, Greater than 15 to 500 ppm Sulfur (Thousand Barrels per Day) | ||||||||
| Year | Jan | Feb | Mar | Apr | May | Jun | Jul | Aug | Sep | Oct | Nov | Dec |
|---|---|---|---|---|---|---|---|---|---|---|---|---|
| 2004 | 0 | 0 | 0 | 0 | -1 | 3 | 0 | -8 | ||||
| 2005 | -3 | -9 | -10 | -4 | -9 | -4 | -1 | 0 | ||||
| 2006 | 0 | -10 | -9 | -15 | 0 | -8 | -9 | -10 | -7 | -8 | ||
| 2007 | -16 | -25 | -20 | 0 | -9 | -75 | -41 | -54 | -44 | -18 | -18 | -43 |
| 2008 | -56 | -108 | -75 | -107 | -102 | -91 | -32 | -46 | -38 | -26 | -10 | -24 |
| 2009 | -23 | -3 | -26 | -31 | -37 | -21 | -28 | -10 | -4 | -27 | -22 | |
| 2010 | -37 | -40 | -31 | -24 | -26 | -40 | -19 | -14 | -16 | -22 | ||
| 2011 | -25 | -30 | -9 | 0 | 0 | -3 | -18 | |||||
| 2012 | -38 | 0 | 0 | -9 | 0 | |||||||
| 2013 | -11 | -9 | -6 | -19 | -11 | -11 | -10 | -10 | -9 | |||
| 2014 | -10 | -10 | -10 | -9 | ||||||||
| 2015 | -20 | -10 | -11 | -10 | -11 | |||||||
| 2016 | -8 | -6 | -10 | 0 | -7 | -10 | ||||||
| 2017 | -10 | |||||||||||
| 2018 | -10 | -5 | -10 | -18 | -14 | |||||||
| 2019 | -10 | -10 | ||||||||||
| 2020 | 0 | -9 | ||||||||||
| 2021 | 0 | -10 | 0 | |||||||||
| 2022 | 0 | -5 | ||||||||||
| 2023 | 0 | |||||||||||
| - = No Data Reported; -- = Not Applicable; NA = Not Available; W = Withheld to avoid disclosure of individual company data. |
| Release Date: 8/30/2024 |
| Next Release Date: 9/30/2024 |