|
Download Data (XLS File) |
|
||||||||
|
||||||||
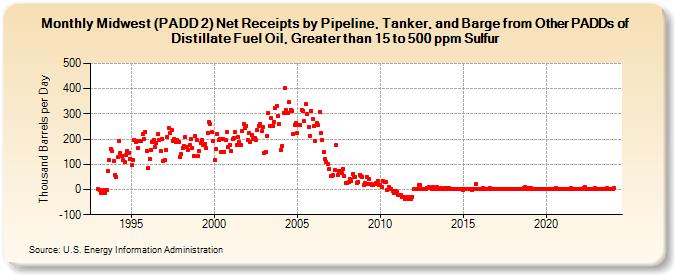
| Midwest (PADD 2) Net Receipts by Pipeline, Tanker, and Barge from Other PADDs of Distillate Fuel Oil, Greater than 15 to 500 ppm Sulfur (Thousand Barrels per Day) | ||||||||
| Year | Jan | Feb | Mar | Apr | May | Jun | Jul | Aug | Sep | Oct | Nov | Dec |
|---|---|---|---|---|---|---|---|---|---|---|---|---|
| 1993 | 1 | -3 | -15 | -14 | -3 | -12 | -1 | 73 | 116 | 162 | 153 | 115 |
| 1994 | 58 | 50 | 127 | 194 | 144 | 132 | 117 | 108 | 136 | 153 | 146 | 123 |
| 1995 | 99 | 118 | 196 | 189 | 192 | 164 | 191 | 192 | 219 | 202 | 230 | 151 |
| 1996 | 85 | 123 | 158 | 187 | 198 | 168 | 183 | 220 | 196 | 151 | 201 | 114 |
| 1997 | 116 | 157 | 209 | 244 | 223 | 235 | 191 | 201 | 189 | 197 | 190 | 127 |
| 1998 | 139 | 164 | 173 | 208 | 169 | 156 | 175 | 200 | 166 | 134 | 212 | 196 |
| 1999 | 132 | 154 | 183 | 196 | 177 | 182 | 163 | 226 | 269 | 259 | 228 | 194 |
| 2000 | 116 | 162 | 222 | 196 | 202 | 147 | 202 | 150 | 196 | 230 | 168 | 176 |
| 2001 | 152 | 199 | 206 | 227 | 177 | 208 | 187 | 176 | 234 | 259 | 244 | 253 |
| 2002 | 197 | 225 | 188 | 217 | 200 | 206 | 196 | 235 | 252 | 261 | 231 | 247 |
| 2003 | 143 | 150 | 212 | 304 | 253 | 282 | 251 | 269 | 324 | 330 | 290 | 259 |
| 2004 | 158 | 173 | 305 | 401 | 314 | 303 | 346 | 317 | 312 | 221 | 257 | 264 |
| 2005 | 226 | 256 | 257 | 317 | 312 | 270 | 339 | 299 | 249 | 213 | 313 | 281 |
| 2006 | 252 | 194 | 265 | 254 | 306 | 223 | 196 | 149 | 123 | 110 | 101 | 81 |
| 2007 | 52 | 53 | 57 | 77 | 176 | 59 | 74 | 74 | 64 | 82 | 54 | 27 |
| 2008 | 24 | 29 | 42 | 34 | 61 | 51 | 50 | 27 | 31 | 57 | 52 | 51 |
| 2009 | 18 | 25 | 50 | 21 | 40 | 21 | 19 | 18 | 21 | 24 | 35 | 18 |
| 2010 | 19 | 8 | 34 | 28 | 31 | -2 | 10 | 1 | 3 | -6 | -15 | -4 |
| 2011 | -8 | -20 | -20 | -20 | -31 | -31 | -38 | -32 | -30 | -39 | -38 | -28 |
| 2012 | 1 | 4 | 2 | 2 | 18 | 16 | 1 | 1 | 3 | 4 | 5 | 8 |
| 2013 | 5 | 1 | 8 | 2 | 5 | 8 | 3 | 4 | 5 | 3 | 3 | 7 |
| 2014 | 2 | 6 | 6 | 2 | 4 | 3 | 1 | 3 | 4 | 2 | 4 | 4 |
| 2015 | 0 | 2 | 3 | 2 | 3 | 2 | 0 | 4 | 3 | 21 | 2 | 4 |
| 2016 | 2 | 3 | 6 | 2 | 4 | 4 | 1 | 5 | 2 | 2 | 3 | 3 |
| 2017 | 2 | 3 | 2 | 3 | 3 | 4 | 3 | 2 | 4 | 3 | 3 | 4 |
| 2018 | 3 | 3 | 2 | 4 | 2 | 3 | 4 | 4 | 6 | 9 | 3 | 5 |
| 2019 | 4 | 5 | 4 | 3 | 4 | 3 | 2 | 4 | 4 | 3 | 4 | 4 |
| 2020 | 1 | 1 | 3 | 2 | 2 | 4 | 1 | 5 | 4 | 2 | 3 | 3 |
| 2021 | 1 | 2 | 1 | 4 | 3 | 3 | 6 | 3 | 2 | 4 | 4 | 3 |
| 2022 | 4 | 2 | 3 | 7 | 10 | 3 | 4 | 2 | 3 | 1 | 3 | 5 |
| 2023 | 3 | 2 | 2 | 2 | 3 | 4 | 4 | 4 | 5 | 3 | 4 | 4 |
| 2024 | 4 | |||||||||||
| - = No Data Reported; -- = Not Applicable; NA = Not Available; W = Withheld to avoid disclosure of individual company data. |
| Release Date: 3/29/2024 |
| Next Release Date: 4/30/2024 |