|
Download Data (XLS File) |
|
||||||||
|
||||||||
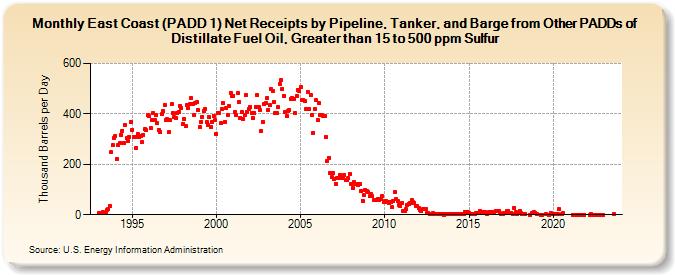
| East Coast (PADD 1) Net Receipts by Pipeline, Tanker, and Barge from Other PADDs of Distillate Fuel Oil, Greater than 15 to 500 ppm Sulfur (Thousand Barrels per Day) | ||||||||
| Year | Jan | Feb | Mar | Apr | May | Jun | Jul | Aug | Sep | Oct | Nov | Dec |
|---|---|---|---|---|---|---|---|---|---|---|---|---|
| 1993 | 6 | 6 | 6 | 10 | 8 | 6 | 18 | 23 | 36 | 247 | 275 | 305 |
| 1994 | 312 | 223 | 276 | 284 | 317 | 334 | 284 | 356 | 303 | 293 | 309 | 369 |
| 1995 | 338 | 310 | 307 | 264 | 321 | 307 | 311 | 287 | 317 | 340 | 335 | 395 |
| 1996 | 390 | 343 | 375 | 403 | 376 | 394 | 363 | 336 | 329 | 398 | 410 | 436 |
| 1997 | 375 | 378 | 327 | 376 | 438 | 403 | 386 | 385 | 402 | 409 | 433 | 423 |
| 1998 | 361 | 380 | 353 | 435 | 425 | 438 | 463 | 439 | 394 | 445 | 446 | 415 |
| 1999 | 347 | 369 | 389 | 413 | 421 | 366 | 357 | 388 | 348 | 369 | 393 | 375 |
| 2000 | 322 | 404 | 405 | 363 | 419 | 443 | 368 | 422 | 395 | 430 | 483 | 472 |
| 2001 | 472 | 407 | 396 | 481 | 448 | 383 | 407 | 381 | 395 | 474 | 409 | 421 |
| 2002 | 429 | 405 | 383 | 405 | 429 | 475 | 426 | 415 | 333 | 369 | 439 | 442 |
| 2003 | 464 | 417 | 434 | 498 | 492 | 448 | 404 | 402 | 427 | 518 | 533 | 499 |
| 2004 | 472 | 408 | 391 | 411 | 415 | 460 | 463 | 461 | 403 | 471 | 496 | 490 |
| 2005 | 505 | 456 | 455 | 451 | 420 | 488 | 419 | 475 | 397 | 326 | 419 | 454 |
| 2006 | 376 | 443 | 396 | 394 | 392 | 391 | 308 | 215 | 226 | 166 | 149 | 164 |
| 2007 | 142 | 123 | 145 | 146 | 159 | 147 | 146 | 158 | 138 | 139 | 146 | 162 |
| 2008 | 123 | 106 | 129 | 123 | 120 | 118 | 120 | 94 | 56 | 79 | 99 | 93 |
| 2009 | 89 | 73 | 81 | 73 | 59 | 58 | 59 | 64 | 60 | 61 | 73 | 51 |
| 2010 | 54 | 53 | 52 | 47 | 51 | 29 | 55 | 89 | 61 | 55 | 37 | 36 |
| 2011 | 46 | 16 | 14 | 21 | 39 | 44 | 46 | 57 | 49 | 48 | 36 | 33 |
| 2012 | 28 | 20 | 13 | 21 | 21 | 22 | 7 | 7 | 3 | 4 | 5 | 3 |
| 2013 | 1 | 1 | 2 | 3 | 2 | 2 | 0 | 1 | 3 | 1 | 2 | 3 |
| 2014 | 2 | 2 | 2 | 2 | 3 | 2 | 4 | 1 | 1 | 12 | 10 | 10 |
| 2015 | 8 | 4 | 2 | 2 | 3 | 8 | 5 | 5 | 14 | 12 | 7 | 9 |
| 2016 | 6 | 4 | 10 | 6 | 10 | 8 | 11 | 14 | 13 | 15 | 6 | 3 |
| 2017 | 3 | 6 | 7 | 13 | 15 | 7 | 8 | 3 | 28 | 11 | 1 | 8 |
| 2018 | 15 | 5 | 1 | 1 | 0 | 6 | 9 | 8 | ||||
| 2019 | 3 | 0 | 0 | 2 | 0 | 6 | 1 | |||||
| 2020 | 2 | 2 | 1 | 1 | 22 | 1 | 5 | |||||
| 2021 | 0 | 0 | 0 | 0 | 0 | 0 | 0 | 0 | 0 | |||
| 2022 | 0 | 2 | 0 | 0 | 0 | 0 | 0 | 0 | 0 | |||
| 2023 | 3 | |||||||||||
| - = No Data Reported; -- = Not Applicable; NA = Not Available; W = Withheld to avoid disclosure of individual company data. |
| Release Date: 3/29/2024 |
| Next Release Date: 4/30/2024 |