|
Download Data (XLS File) |
|
||||||||
|
||||||||
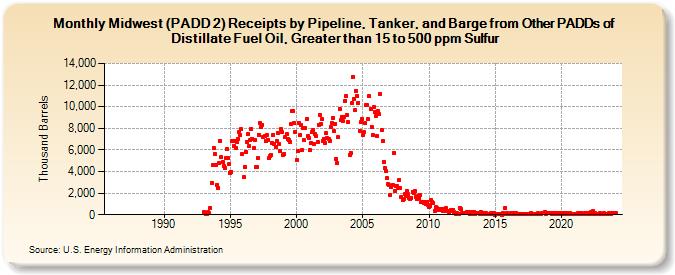
| Midwest (PADD 2) Receipts by Pipeline, Tanker, and Barge from Other PADDs of Distillate Fuel Oil, Greater than 15 to 500 ppm Sulfur (Thousand Barrels) | ||||||||
| Year | Jan | Feb | Mar | Apr | May | Jun | Jul | Aug | Sep | Oct | Nov | Dec |
|---|---|---|---|---|---|---|---|---|---|---|---|---|
| 1986 | -- | -- | -- | -- | -- | -- | -- | -- | -- | -- | -- | -- |
| 1987 | -- | -- | -- | -- | -- | -- | -- | -- | -- | -- | -- | -- |
| 1988 | -- | -- | -- | -- | -- | -- | -- | -- | -- | -- | -- | -- |
| 1989 | -- | -- | -- | -- | -- | -- | -- | -- | -- | -- | -- | -- |
| 1990 | -- | -- | -- | -- | -- | -- | -- | -- | -- | -- | -- | -- |
| 1991 | -- | -- | -- | -- | -- | -- | -- | -- | -- | -- | -- | -- |
| 1992 | -- | -- | -- | -- | -- | -- | -- | -- | -- | -- | -- | -- |
| 1993 | 226 | 193 | 38 | 59 | 249 | 129 | 636 | 2,980 | 4,610 | 6,160 | 5,631 | 4,602 |
| 1994 | 2,766 | 2,469 | 4,778 | 6,869 | 5,319 | 4,891 | 4,468 | 4,368 | 5,268 | 6,096 | 5,253 | 4,717 |
| 1995 | 3,870 | 3,976 | 6,852 | 6,358 | 6,843 | 6,216 | 6,756 | 7,035 | 7,663 | 7,334 | 7,898 | 5,614 |
| 1996 | 3,484 | 4,418 | 5,847 | 6,775 | 7,455 | 6,348 | 6,879 | 7,980 | 7,016 | 6,131 | 6,960 | 4,381 |
| 1997 | 4,460 | 5,263 | 7,406 | 8,465 | 8,154 | 8,310 | 7,225 | 7,285 | 6,801 | 7,344 | 6,941 | 5,213 |
| 1998 | 5,456 | 5,547 | 6,622 | 7,404 | 6,533 | 6,258 | 6,823 | 7,592 | 6,564 | 5,859 | 7,930 | 7,615 |
| 1999 | 5,503 | 5,643 | 7,187 | 7,476 | 7,014 | 6,904 | 6,764 | 8,402 | 9,641 | 9,608 | 8,481 | 7,697 |
| 2000 | 5,079 | 5,917 | 8,514 | 7,410 | 8,292 | 5,983 | 8,025 | 6,909 | 7,983 | 8,842 | 7,242 | 7,083 |
| 2001 | 5,974 | 6,615 | 7,682 | 7,858 | 6,580 | 7,491 | 7,246 | 6,767 | 8,321 | 9,241 | 8,399 | 8,833 |
| 2002 | 6,841 | 7,016 | 6,640 | 7,535 | 7,101 | 6,977 | 6,841 | 8,150 | 8,499 | 8,990 | 7,733 | 8,442 |
| 2003 | 5,179 | 4,775 | 7,170 | 9,810 | 8,730 | 9,071 | 8,641 | 9,066 | 10,571 | 11,003 | 9,236 | 8,599 |
| 2004 | 5,561 | 5,721 | 10,316 | 12,772 | 10,708 | 9,661 | 11,472 | 10,973 | 10,384 | 7,746 | 8,567 | 8,888 |
| 2005 | 7,416 | 7,641 | 8,457 | 10,134 | 10,117 | 8,823 | 10,987 | 9,801 | 8,131 | 7,350 | 9,965 | 9,495 |
| 2006 | 9,119 | 7,269 | 9,574 | 9,281 | 11,174 | 7,861 | 6,787 | 4,908 | 4,303 | 4,003 | 3,385 | 2,833 |
| 2007 | 2,732 | 1,851 | 2,600 | 2,723 | 5,755 | 2,211 | 2,628 | 2,631 | 2,467 | 3,232 | 2,461 | 1,652 |
| 2008 | 1,329 | 1,440 | 1,891 | 1,733 | 2,188 | 1,882 | 1,553 | 1,499 | 1,576 | 2,137 | 1,988 | 2,211 |
| 2009 | 1,637 | 1,422 | 1,699 | 1,504 | 1,860 | 1,138 | 1,183 | 1,100 | 1,165 | 1,038 | 1,203 | 936 |
| 2010 | 751 | 792 | 1,383 | 1,175 | 1,093 | 366 | 671 | 602 | 465 | 487 | 469 | 535 |
| 2011 | 537 | 320 | 568 | 613 | 322 | 334 | 278 | 335 | 421 | 312 | 475 | 242 |
| 2012 | 95 | 129 | 106 | 107 | 650 | 518 | 115 | 114 | 167 | 165 | 231 | 297 |
| 2013 | 218 | 76 | 263 | 86 | 166 | 261 | 93 | 157 | 152 | 121 | 112 | 254 |
| 2014 | 69 | 156 | 194 | 59 | 135 | 86 | 44 | 93 | 134 | 66 | 105 | 134 |
| 2015 | 9 | 64 | 106 | 61 | 104 | 53 | 5 | 116 | 97 | 663 | 58 | 130 |
| 2016 | 53 | 79 | 178 | 53 | 129 | 105 | 43 | 144 | 65 | 56 | 92 | 100 |
| 2017 | 65 | 95 | 49 | 95 | 100 | 110 | 105 | 50 | 113 | 105 | 104 | 110 |
| 2018 | 78 | 85 | 77 | 113 | 50 | 96 | 114 | 114 | 172 | 278 | 102 | 153 |
| 2019 | 124 | 134 | 137 | 93 | 125 | 98 | 55 | 179 | 109 | 80 | 160 | 166 |
| 2020 | 94 | 99 | 126 | 92 | 73 | 120 | 65 | 164 | 125 | 73 | 80 | 91 |
| 2021 | 23 | 42 | 42 | 116 | 104 | 100 | 191 | 81 | 60 | 136 | 134 | 108 |
| 2022 | 135 | 54 | 86 | 209 | 300 | 101 | 117 | 75 | 91 | 25 | 104 | 147 |
| 2023 | 88 | 56 | 128 | 69 | 98 | 105 | 109 | 118 | 137 | 95 | 126 | 133 |
| 2024 | 133 | |||||||||||
| - = No Data Reported; -- = Not Applicable; NA = Not Available; W = Withheld to avoid disclosure of individual company data. |
| Release Date: 3/29/2024 |
| Next Release Date: 4/30/2024 |
Referring Pages: