|
Download Data (XLS File) |
|
||||||||
|
||||||||
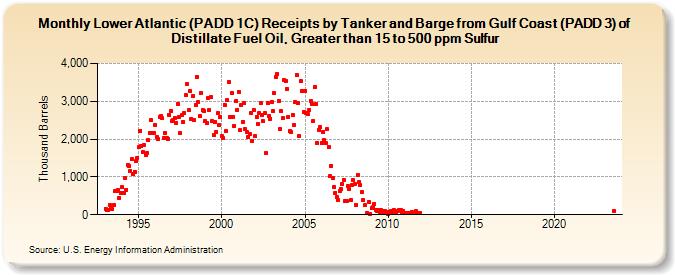
| Lower Atlantic (PADD 1C) Receipts by Tanker and Barge from Gulf Coast (PADD 3) of Distillate Fuel Oil, Greater than 15 to 500 ppm Sulfur (Thousand Barrels) | ||||||||
| Year | Jan | Feb | Mar | Apr | May | Jun | Jul | Aug | Sep | Oct | Nov | Dec |
|---|---|---|---|---|---|---|---|---|---|---|---|---|
| 1993 | 161 | 127 | 137 | 252 | 208 | 147 | 257 | 619 | 624 | 651 | 450 | 565 |
| 1994 | 733 | 566 | 960 | 661 | 1,321 | 1,279 | 1,161 | 1,477 | 1,082 | 1,141 | 1,408 | 1,505 |
| 1995 | 1,785 | 2,227 | 1,807 | 1,654 | 1,856 | 1,591 | 1,638 | 1,972 | 2,173 | 2,495 | 2,161 | 2,151 |
| 1996 | 2,373 | 2,052 | 2,006 | 2,584 | 2,613 | 2,548 | 2,026 | 2,162 | 2,027 | 2,010 | 2,637 | 2,745 |
| 1997 | 2,468 | 2,509 | 2,571 | 2,435 | 2,941 | 2,581 | 2,149 | 2,631 | 2,459 | 2,691 | 3,156 | 3,446 |
| 1998 | 2,776 | 3,267 | 2,533 | 3,143 | 2,511 | 2,912 | 3,651 | 2,975 | 2,604 | 3,216 | 2,768 | 2,756 |
| 1999 | 2,469 | 2,421 | 3,079 | 2,772 | 3,105 | 2,470 | 2,103 | 2,462 | 2,197 | 2,682 | 2,365 | 2,597 |
| 2000 | 2,077 | 2,027 | 2,913 | 2,208 | 3,026 | 3,511 | 2,595 | 3,214 | 2,588 | 2,349 | 2,995 | 2,779 |
| 2001 | 3,250 | 2,229 | 2,893 | 2,465 | 2,943 | 2,255 | 2,179 | 2,055 | 2,126 | 2,696 | 1,951 | 2,782 |
| 2002 | 2,081 | 2,588 | 2,406 | 2,685 | 2,955 | 2,625 | 2,470 | 2,690 | 1,627 | 2,954 | 2,598 | 2,539 |
| 2003 | 2,982 | 2,732 | 3,215 | 3,652 | 3,723 | 3,003 | 2,274 | 2,730 | 2,562 | 3,553 | 3,525 | 3,337 |
| 2004 | 2,594 | 2,204 | 2,177 | 2,645 | 2,376 | 2,973 | 3,699 | 2,945 | 2,079 | 3,536 | 3,264 | 2,704 |
| 2005 | 3,275 | 2,693 | 2,667 | 2,781 | 3,003 | 2,938 | 2,480 | 3,387 | 2,931 | 1,895 | 2,246 | 2,314 |
| 2006 | 1,897 | 2,193 | 1,963 | 1,894 | 2,254 | 1,796 | 1,017 | 1,285 | 975 | 734 | 585 | 460 |
| 2007 | 377 | 637 | 682 | 802 | 927 | 364 | 374 | 757 | 675 | 395 | 788 | 914 |
| 2008 | 816 | 256 | 1,062 | 870 | 784 | 596 | 384 | 248 | 42 | 347 | 28 | |
| 2009 | 174 | 202 | 286 | 131 | 101 | 132 | 78 | 118 | 53 | 98 | 91 | 73 |
| 2010 | 14 | 72 | 96 | 42 | 125 | 50 | 48 | 106 | 120 | 132 | 54 | 100 |
| 2011 | 42 | 56 | 52 | 52 | 54 | 84 | 52 | 54 | 96 | 56 | 42 | 42 |
| 2012 | 28 | 53 | 28 | 56 | 56 | 56 | 70 | 42 | 28 | 70 | 42 | |
| 2023 | 99 | |||||||||||
| - = No Data Reported; -- = Not Applicable; NA = Not Available; W = Withheld to avoid disclosure of individual company data. |
| Release Date: 3/29/2024 |
| Next Release Date: 4/30/2024 |