|
Download Data (XLS File) |
|
||||||||
|
||||||||
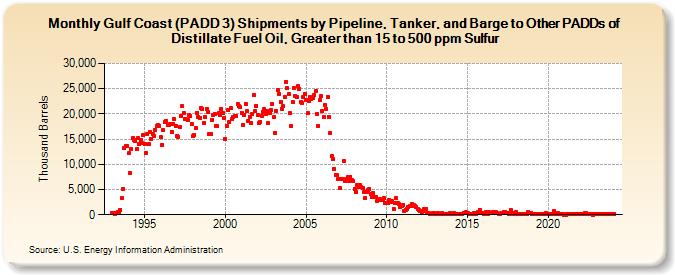
| Gulf Coast (PADD 3) Shipments by Pipeline, Tanker, and Barge to Other PADDs of Distillate Fuel Oil, Greater than 15 to 500 ppm Sulfur (Thousand Barrels) | ||||||||
| Year | Jan | Feb | Mar | Apr | May | Jun | Jul | Aug | Sep | Oct | Nov | Dec |
|---|---|---|---|---|---|---|---|---|---|---|---|---|
| 1993 | 387 | 320 | 175 | 311 | 457 | 276 | 1,034 | 3,387 | 5,115 | 13,313 | 13,636 | 13,662 |
| 1994 | 12,161 | 8,306 | 13,105 | 15,203 | 14,876 | 14,699 | 13,059 | 15,124 | 13,979 | 14,752 | 14,279 | 15,845 |
| 1995 | 14,029 | 12,338 | 16,044 | 13,960 | 16,451 | 15,045 | 16,095 | 15,586 | 16,851 | 17,680 | 17,719 | 17,602 |
| 1996 | 15,352 | 13,909 | 16,804 | 18,368 | 18,641 | 17,734 | 17,814 | 18,011 | 16,491 | 17,998 | 18,931 | 17,604 |
| 1997 | 15,712 | 15,502 | 17,369 | 19,632 | 21,470 | 20,207 | 18,906 | 18,917 | 18,820 | 19,861 | 19,578 | 17,988 |
| 1998 | 15,517 | 15,899 | 17,156 | 20,235 | 19,427 | 19,262 | 21,242 | 21,054 | 18,193 | 19,424 | 20,982 | 20,461 |
| 1999 | 15,935 | 15,990 | 18,884 | 19,705 | 19,897 | 17,598 | 17,535 | 20,199 | 19,822 | 20,937 | 20,255 | 19,162 |
| 2000 | 15,071 | 17,553 | 20,767 | 18,307 | 21,107 | 19,052 | 19,302 | 19,560 | 19,609 | 22,009 | 21,509 | 21,372 |
| 2001 | 20,216 | 17,872 | 19,745 | 22,060 | 20,514 | 18,641 | 19,470 | 18,204 | 19,988 | 23,681 | 20,555 | 21,653 |
| 2002 | 19,813 | 18,161 | 18,415 | 19,583 | 20,339 | 21,008 | 19,931 | 20,667 | 18,170 | 20,272 | 20,723 | 21,921 |
| 2003 | 19,370 | 16,279 | 20,540 | 24,752 | 23,902 | 22,414 | 21,063 | 21,510 | 23,318 | 26,384 | 25,108 | 23,961 |
| 2004 | 20,098 | 17,512 | 22,451 | 25,092 | 23,592 | 23,279 | 25,593 | 24,996 | 22,449 | 22,219 | 23,380 | 24,033 |
| 2005 | 22,837 | 20,157 | 22,527 | 23,353 | 22,944 | 23,075 | 23,815 | 24,489 | 20,043 | 17,696 | 22,691 | 23,488 |
| 2006 | 20,501 | 19,390 | 21,771 | 20,998 | 23,366 | 19,398 | 16,254 | 11,569 | 11,083 | 9,140 | 7,858 | 7,920 |
| 2007 | 7,088 | 5,228 | 7,089 | 7,099 | 10,680 | 6,608 | 7,157 | 7,527 | 6,608 | 7,549 | 6,829 | 6,678 |
| 2008 | 5,136 | 4,500 | 5,887 | 5,417 | 5,913 | 5,422 | 5,264 | 4,419 | 3,270 | 4,581 | 4,953 | 5,080 |
| 2009 | 4,194 | 3,418 | 4,216 | 3,558 | 3,601 | 2,732 | 2,851 | 3,026 | 2,852 | 2,878 | 3,291 | 2,407 |
| 2010 | 2,417 | 2,286 | 3,010 | 2,577 | 2,672 | 1,222 | 2,374 | 3,374 | 2,305 | 2,207 | 1,570 | 1,653 |
| 2011 | 1,963 | 774 | 996 | 1,232 | 1,525 | 1,667 | 1,678 | 2,097 | 1,883 | 1,717 | 1,495 | 1,205 |
| 2012 | 894 | 698 | 464 | 691 | 1,197 | 1,164 | 257 | 257 | 173 | 224 | 307 | 318 |
| 2013 | 194 | 70 | 318 | 159 | 228 | 302 | 107 | 181 | 231 | 144 | 153 | 304 |
| 2014 | 127 | 220 | 265 | 117 | 227 | 144 | 162 | 139 | 176 | 438 | 400 | 446 |
| 2015 | 245 | 189 | 154 | 111 | 199 | 294 | 163 | 264 | 530 | 1,021 | 254 | 397 |
| 2016 | 227 | 186 | 480 | 234 | 452 | 344 | 380 | 568 | 457 | 514 | 283 | 194 |
| 2017 | 155 | 259 | 256 | 481 | 577 | 309 | 358 | 155 | 941 | 436 | 130 | 347 |
| 2018 | 551 | 228 | 103 | 113 | 66 | 96 | 114 | 115 | 172 | 453 | 367 | 389 |
| 2019 | 210 | 134 | 137 | 94 | 126 | 98 | 55 | 179 | 109 | 84 | 304 | 169 |
| 2020 | 94 | 99 | 126 | 92 | 768 | 120 | 65 | 308 | 125 | 73 | 80 | 91 |
| 2021 | 23 | 42 | 43 | 117 | 105 | 101 | 192 | 82 | 61 | 137 | 135 | 108 |
| 2022 | 135 | 54 | 87 | 274 | 301 | 102 | 117 | 76 | 92 | 26 | 105 | 148 |
| 2023 | 88 | 56 | 128 | 69 | 98 | 105 | 109 | 217 | 137 | 95 | 126 | 133 |
| 2024 | 133 | |||||||||||
| - = No Data Reported; -- = Not Applicable; NA = Not Available; W = Withheld to avoid disclosure of individual company data. |
| Release Date: 3/29/2024 |
| Next Release Date: 4/30/2024 |
Referring Pages: