|
Download Data (XLS File) |
|
||||||||
|
||||||||
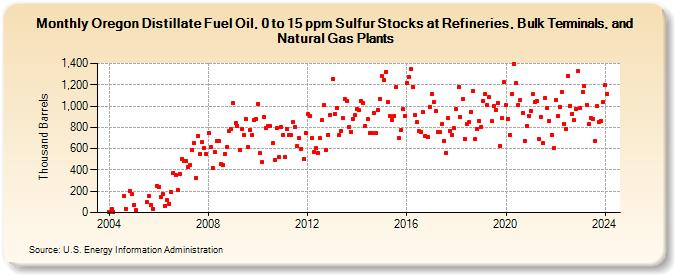
| Oregon Distillate Fuel Oil, 0 to 15 ppm Sulfur Stocks at Refineries, Bulk Terminals, and Natural Gas Plants (Thousand Barrels) | ||||||||
| Year | Jan | Feb | Mar | Apr | May | Jun | Jul | Aug | Sep | Oct | Nov | Dec |
|---|---|---|---|---|---|---|---|---|---|---|---|---|
| 2004 | 5 | 35 | 4 | 159 | 38 | 206 | 170 | |||||
| 2005 | 75 | 24 | 98 | 159 | 74 | 34 | 254 | |||||
| 2006 | 240 | 143 | 174 | 65 | 115 | 85 | 192 | 374 | 350 | 216 | 366 | 506 |
| 2007 | 486 | 483 | 429 | 442 | 591 | 657 | 328 | 720 | 554 | 659 | 609 | 552 |
| 2008 | 747 | 612 | 423 | 573 | 671 | 669 | 460 | 444 | 553 | 619 | 768 | 783 |
| 2009 | 1,027 | 837 | 817 | 586 | 783 | 728 | 879 | 611 | 776 | 730 | 869 | 881 |
| 2010 | 1,024 | 556 | 474 | 901 | 796 | 813 | 812 | 649 | 497 | 791 | 519 | 802 |
| 2011 | 732 | 522 | 788 | 732 | 726 | 849 | 804 | 625 | 698 | 600 | 500 | 746 |
| 2012 | 922 | 906 | 697 | 569 | 602 | 559 | 696 | 869 | 1,008 | 591 | 731 | 916 |
| 2013 | 1,253 | 928 | 979 | 730 | 764 | 892 | 1,063 | 1,049 | 804 | 757 | 879 | 913 |
| 2014 | 971 | 960 | 1,050 | 1,027 | 816 | 874 | 745 | 747 | 935 | 744 | 966 | 1,071 |
| 2015 | 1,281 | 1,246 | 1,323 | 1,038 | 903 | 868 | 908 | 1,180 | 698 | 772 | 968 | 906 |
| 2016 | 1,216 | 1,269 | 1,348 | 1,182 | 920 | 846 | 762 | 759 | 943 | 717 | 713 | 994 |
| 2017 | 1,116 | 1,038 | 950 | 755 | 753 | 829 | 671 | 561 | 886 | 768 | 732 | 790 |
| 2018 | 969 | 1,176 | 900 | 1,067 | 693 | 831 | 847 | 943 | 1,137 | 687 | 783 | 862 |
| 2019 | 807 | 1,051 | 1,113 | 1,006 | 1,081 | 856 | 999 | 967 | 1,031 | 625 | 884 | 1,223 |
| 2020 | 1,012 | 882 | 732 | 1,113 | 1,396 | 1,215 | 1,012 | 1,053 | 934 | 675 | 816 | 906 |
| 2021 | 957 | 1,110 | 1,042 | 1,051 | 693 | 895 | 651 | 1,076 | 981 | 859 | 730 | 606 |
| 2022 | 1,055 | 908 | 991 | 1,133 | 832 | 783 | 1,286 | 1,004 | 928 | 870 | 975 | 1,325 |
| 2023 | 980 | 1,135 | 1,186 | 1,009 | 831 | 892 | 879 | 673 | 997 | 854 | 863 | 1,035 |
| 2024 | 1,197 | |||||||||||
| - = No Data Reported; -- = Not Applicable; NA = Not Available; W = Withheld to avoid disclosure of individual company data. |
| Release Date: 3/29/2024 |
| Next Release Date: 4/30/2024 |