|
Download Data (XLS File) |
|
||||||||
|
||||||||
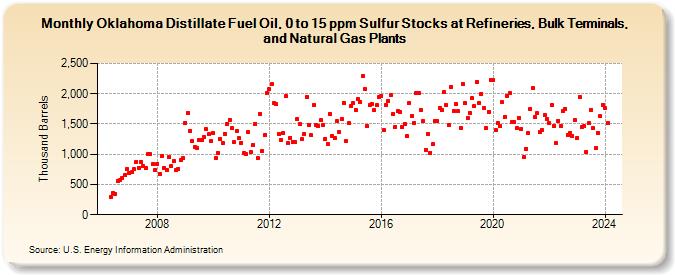
| Oklahoma Distillate Fuel Oil, 0 to 15 ppm Sulfur Stocks at Refineries, Bulk Terminals, and Natural Gas Plants (Thousand Barrels) | ||||||||
| Year | Jan | Feb | Mar | Apr | May | Jun | Jul | Aug | Sep | Oct | Nov | Dec |
|---|---|---|---|---|---|---|---|---|---|---|---|---|
| 2006 | 300 | 361 | 343 | 559 | 566 | 606 | 649 | 752 | ||||
| 2007 | 692 | 698 | 748 | 872 | 777 | 875 | 798 | 779 | 1,000 | 996 | 836 | 740 |
| 2008 | 843 | 676 | 974 | 776 | 747 | 952 | 799 | 889 | 733 | 758 | 904 | 932 |
| 2009 | 1,521 | 1,686 | 1,391 | 1,218 | 1,121 | 1,096 | 1,236 | 1,242 | 1,288 | 1,409 | 1,330 | 1,211 |
| 2010 | 1,348 | 938 | 1,022 | 1,252 | 1,191 | 1,341 | 1,503 | 1,573 | 1,430 | 1,198 | 1,391 | 1,262 |
| 2011 | 1,191 | 1,021 | 1,005 | 1,362 | 1,034 | 1,153 | 1,507 | 934 | 1,671 | 1,053 | 1,315 | 2,004 |
| 2012 | 2,077 | 2,160 | 1,839 | 1,832 | 1,331 | 1,236 | 1,354 | 1,956 | 1,189 | 1,270 | 1,209 | 1,198 |
| 2013 | 1,575 | 1,494 | 1,245 | 1,340 | 1,938 | 1,491 | 1,313 | 1,815 | 1,479 | 1,467 | 1,559 | 1,482 |
| 2014 | 1,258 | 1,163 | 1,669 | 1,302 | 1,263 | 1,542 | 1,375 | 1,582 | 1,853 | 1,214 | 1,508 | 1,797 |
| 2015 | 1,839 | 1,730 | 1,908 | 1,864 | 2,292 | 2,070 | 1,463 | 1,810 | 1,835 | 1,724 | 1,809 | 1,938 |
| 2016 | 1,970 | 1,396 | 1,806 | 1,886 | 1,978 | 1,661 | 1,455 | 1,707 | 1,691 | 1,457 | 1,495 | 1,295 |
| 2017 | 1,847 | 1,630 | 1,516 | 2,012 | 2,009 | 1,725 | 1,541 | 1,075 | 1,340 | 1,026 | 1,162 | 1,545 |
| 2018 | 1,546 | 1,761 | 1,723 | 2,023 | 1,810 | 1,475 | 2,119 | 1,717 | 1,826 | 1,707 | 1,436 | 2,154 |
| 2019 | 1,841 | 1,602 | 1,689 | 1,923 | 1,793 | 2,198 | 1,848 | 2,002 | 1,769 | 1,435 | 1,703 | 2,235 |
| 2020 | 2,226 | 1,396 | 1,513 | 1,464 | 1,856 | 1,622 | 1,970 | 2,011 | 1,536 | 1,531 | 1,432 | 1,604 |
| 2021 | 1,420 | 953 | 1,091 | 1,358 | 1,755 | 2,089 | 1,615 | 1,677 | 1,368 | 1,397 | 1,646 | 1,574 |
| 2022 | 1,517 | 1,813 | 1,470 | 1,181 | 1,557 | 1,467 | 1,717 | 1,753 | 1,325 | 1,347 | 1,308 | 1,566 |
| 2023 | 1,270 | 1,950 | 1,449 | 1,459 | 1,044 | 1,510 | 1,737 | 1,426 | 1,099 | 1,354 | 1,624 | 1,819 |
| 2024 | 1,756 | |||||||||||
| - = No Data Reported; -- = Not Applicable; NA = Not Available; W = Withheld to avoid disclosure of individual company data. |
| Release Date: 3/29/2024 |
| Next Release Date: 4/30/2024 |