|
Download Data (XLS File) |
|
||||||||
|
||||||||
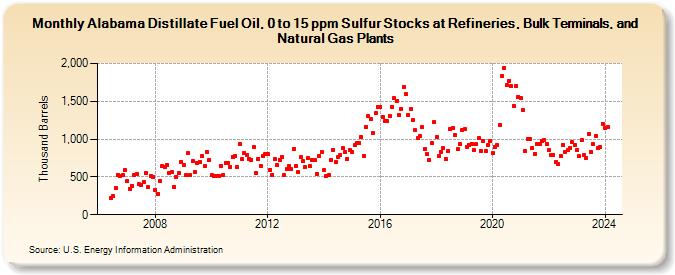
| Alabama Distillate Fuel Oil, 0 to 15 ppm Sulfur Stocks at Refineries, Bulk Terminals, and Natural Gas Plants (Thousand Barrels) | ||||||||
| Year | Jan | Feb | Mar | Apr | May | Jun | Jul | Aug | Sep | Oct | Nov | Dec |
|---|---|---|---|---|---|---|---|---|---|---|---|---|
| 2006 | 217 | 245 | 359 | 528 | 506 | 522 | 590 | |||||
| 2007 | 445 | 341 | 386 | 530 | 545 | 400 | 397 | 436 | 550 | 363 | 512 | 501 |
| 2008 | 333 | 278 | 450 | 640 | 625 | 651 | 557 | 559 | 369 | 504 | 558 | 703 |
| 2009 | 659 | 522 | 817 | 521 | 709 | 563 | 681 | 696 | 781 | 643 | 831 | 726 |
| 2010 | 525 | 517 | 515 | 506 | 644 | 528 | 690 | 688 | 637 | 762 | 780 | 630 |
| 2011 | 936 | 736 | 814 | 792 | 743 | 729 | 895 | 546 | 743 | 647 | 775 | 809 |
| 2012 | 806 | 593 | 528 | 731 | 657 | 728 | 761 | 520 | 600 | 649 | 599 | 874 |
| 2013 | 641 | 564 | 762 | 704 | 628 | 748 | 642 | 721 | 725 | 545 | 776 | 834 |
| 2014 | 590 | 514 | 520 | 728 | 857 | 701 | 766 | 787 | 880 | 827 | 741 | 851 |
| 2015 | 830 | 918 | 944 | 943 | 1,023 | 782 | 1,164 | 1,301 | 1,266 | 1,075 | 1,340 | 1,427 |
| 2016 | 1,428 | 1,290 | 1,233 | 1,234 | 1,301 | 1,429 | 1,537 | 1,501 | 1,313 | 1,398 | 1,690 | 1,594 |
| 2017 | 1,323 | 1,394 | 1,249 | 1,116 | 1,013 | 1,044 | 1,154 | 867 | 803 | 724 | 943 | 1,229 |
| 2018 | 1,022 | 774 | 831 | 881 | 738 | 837 | 1,139 | 1,150 | 1,048 | 865 | 934 | 1,114 |
| 2019 | 1,127 | 900 | 924 | 937 | 853 | 932 | 1,011 | 838 | 980 | 843 | 921 | 972 |
| 2020 | 811 | 901 | 921 | 1,189 | 1,838 | 1,940 | 1,711 | 1,773 | 1,700 | 1,442 | 1,696 | 1,562 |
| 2021 | 1,537 | 1,380 | 837 | 998 | 996 | 879 | 807 | 929 | 935 | 974 | 988 | 935 |
| 2022 | 858 | 784 | 790 | 699 | 671 | 783 | 926 | 829 | 850 | 886 | 962 | 920 |
| 2023 | 859 | 770 | 983 | 795 | 753 | 1,071 | 833 | 930 | 1,041 | 880 | 896 | 1,204 |
| 2024 | 1,147 | |||||||||||
| - = No Data Reported; -- = Not Applicable; NA = Not Available; W = Withheld to avoid disclosure of individual company data. |
| Release Date: 3/29/2024 |
| Next Release Date: 4/30/2024 |