|
Download Data (XLS File) |
|
||||||||
|
||||||||
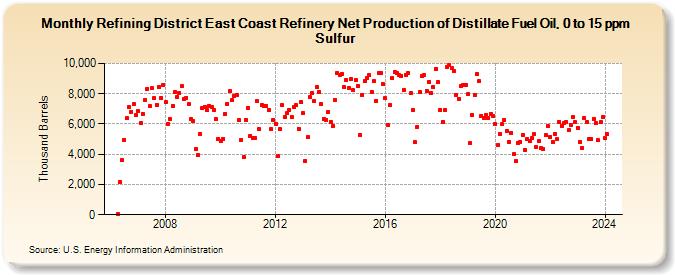
| Refining District East Coast Refinery Net Production of Distillate Fuel Oil, 0 to 15 ppm Sulfur (Thousand Barrels) | ||||||||
| Year | Jan | Feb | Mar | Apr | May | Jun | Jul | Aug | Sep | Oct | Nov | Dec |
|---|---|---|---|---|---|---|---|---|---|---|---|---|
| 2006 | 31 | 2,160 | 3,642 | 4,968 | 6,378 | 7,094 | 6,817 | 7,317 | 6,593 | |||
| 2007 | 6,868 | 6,079 | 6,679 | 7,573 | 8,343 | 7,164 | 8,359 | 7,709 | 7,267 | 8,456 | 7,705 | 8,598 |
| 2008 | 7,428 | 6,030 | 6,311 | 7,181 | 8,130 | 7,783 | 8,046 | 8,480 | 7,628 | 7,737 | 7,303 | 6,303 |
| 2009 | 6,188 | 4,347 | 3,961 | 5,346 | 7,025 | 7,147 | 6,931 | 7,198 | 7,097 | 6,914 | 6,298 | 5,017 |
| 2010 | 4,878 | 5,027 | 6,643 | 7,350 | 8,148 | 7,562 | 7,838 | 7,934 | 6,262 | 4,939 | 3,788 | 6,293 |
| 2011 | 7,063 | 5,227 | 5,073 | 5,087 | 7,491 | 5,661 | 7,274 | 7,187 | 7,178 | 6,917 | 5,636 | 6,281 |
| 2012 | 6,018 | 3,895 | 5,651 | 7,230 | 6,452 | 6,697 | 6,935 | 6,468 | 7,092 | 7,238 | 5,673 | 7,434 |
| 2013 | 6,695 | 3,556 | 5,141 | 7,757 | 8,033 | 7,505 | 8,420 | 8,125 | 7,296 | 6,347 | 6,271 | 6,797 |
| 2014 | 6,151 | 5,855 | 7,592 | 9,401 | 9,262 | 9,322 | 8,419 | 8,896 | 8,384 | 8,961 | 8,222 | 8,894 |
| 2015 | 8,514 | 5,264 | 7,918 | 8,855 | 9,068 | 9,228 | 8,128 | 8,820 | 7,520 | 9,340 | 9,358 | 8,619 |
| 2016 | 7,705 | 5,933 | 7,257 | 9,014 | 9,452 | 9,367 | 9,253 | 9,183 | 8,243 | 9,233 | 9,350 | 8,031 |
| 2017 | 6,895 | 4,789 | 5,800 | 8,092 | 9,172 | 9,212 | 8,203 | 8,796 | 8,054 | 8,452 | 9,667 | 8,756 |
| 2018 | 6,927 | 6,147 | 6,932 | 9,796 | 9,873 | 9,718 | 9,480 | 7,925 | 7,680 | 8,510 | 8,597 | 8,583 |
| 2019 | 7,962 | 4,740 | 6,580 | 7,948 | 9,301 | 8,810 | 6,528 | 6,396 | 6,613 | 6,414 | 6,640 | 6,517 |
| 2020 | 5,984 | 4,612 | 5,369 | 5,971 | 6,287 | 5,519 | 4,809 | 5,413 | 3,993 | 3,546 | 4,746 | 4,830 |
| 2021 | 5,302 | 4,296 | 5,020 | 4,845 | 5,040 | 5,316 | 4,481 | 4,865 | 4,391 | 4,336 | 5,243 | 5,881 |
| 2022 | 5,163 | 4,815 | 5,336 | 4,985 | 6,149 | 5,887 | 6,039 | 6,153 | 5,573 | 5,901 | 6,446 | 6,110 |
| 2023 | 5,755 | 4,830 | 4,440 | 6,367 | 6,119 | 5,004 | 4,984 | 6,360 | 6,061 | 4,914 | 6,115 | 6,448 |
| 2024 | 5,063 | |||||||||||
| - = No Data Reported; -- = Not Applicable; NA = Not Available; W = Withheld to avoid disclosure of individual company data. |
| Release Date: 3/29/2024 |
| Next Release Date: 4/30/2024 |