|
Download Data (XLS File) |
|
||||||||
|
||||||||
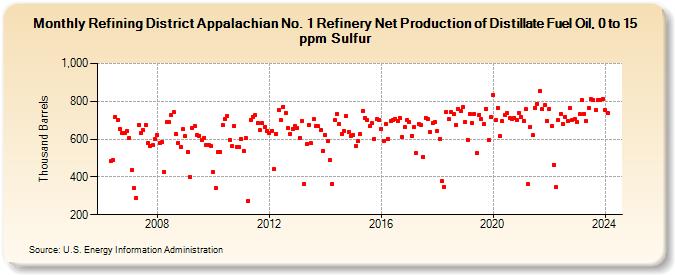
| Refining District Appalachian No. 1 Refinery Net Production of Distillate Fuel Oil, 0 to 15 ppm Sulfur (Thousand Barrels) | ||||||||
| Year | Jan | Feb | Mar | Apr | May | Jun | Jul | Aug | Sep | Oct | Nov | Dec |
|---|---|---|---|---|---|---|---|---|---|---|---|---|
| 2006 | 483 | 488 | 719 | 702 | 654 | 633 | 631 | 641 | ||||
| 2007 | 605 | 439 | 339 | 291 | 676 | 631 | 647 | 674 | 581 | 564 | 567 | 599 |
| 2008 | 621 | 581 | 585 | 428 | 688 | 688 | 730 | 742 | 627 | 581 | 559 | 651 |
| 2009 | 615 | 533 | 400 | 659 | 669 | 624 | 619 | 594 | 608 | 570 | 567 | 566 |
| 2010 | 427 | 341 | 530 | 531 | 677 | 708 | 724 | 596 | 563 | 669 | 560 | 558 |
| 2011 | 598 | 537 | 605 | 274 | 701 | 718 | 725 | 687 | 646 | 685 | 664 | 643 |
| 2012 | 631 | 645 | 440 | 627 | 755 | 702 | 772 | 738 | 661 | 629 | 654 | 671 |
| 2013 | 657 | 606 | 697 | 364 | 572 | 677 | 577 | 704 | 669 | 667 | 648 | 539 |
| 2014 | 622 | 590 | 490 | 364 | 700 | 735 | 680 | 627 | 645 | 721 | 640 | 617 |
| 2015 | 623 | 562 | 588 | 626 | 750 | 714 | 700 | 669 | 683 | 600 | 704 | 703 |
| 2016 | 656 | 592 | 681 | 602 | 697 | 701 | 708 | 695 | 711 | 609 | 665 | 703 |
| 2017 | 689 | 618 | 662 | 527 | 678 | 677 | 507 | 714 | 704 | 638 | 686 | 691 |
| 2018 | 645 | 602 | 378 | 349 | 744 | 704 | 741 | 734 | 676 | 761 | 748 | 768 |
| 2019 | 693 | 597 | 735 | 686 | 733 | 524 | 730 | 704 | 680 | 761 | 595 | 715 |
| 2020 | 832 | 699 | 765 | 615 | 695 | 729 | 737 | 710 | 708 | 714 | 702 | 740 |
| 2021 | 719 | 696 | 757 | 362 | 666 | 620 | 766 | 788 | 854 | 757 | 778 | 698 |
| 2022 | 760 | 669 | 465 | 344 | 701 | 735 | 679 | 717 | 696 | 766 | 703 | 704 |
| 2023 | 688 | 731 | 808 | 735 | 695 | 765 | 810 | 807 | 754 | 807 | 806 | 813 |
| 2024 | 756 | |||||||||||
| - = No Data Reported; -- = Not Applicable; NA = Not Available; W = Withheld to avoid disclosure of individual company data. |
| Release Date: 3/29/2024 |
| Next Release Date: 4/30/2024 |