|
Download Data (XLS File) |
|
||||||||
|
||||||||
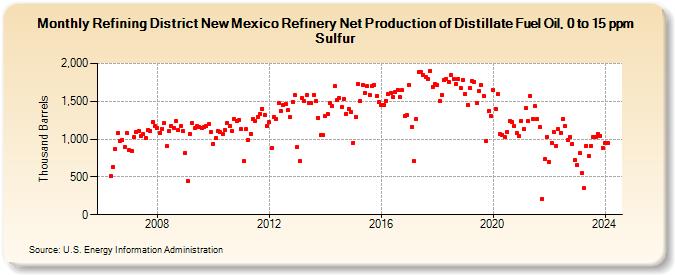
| Refining District New Mexico Refinery Net Production of Distillate Fuel Oil, 0 to 15 ppm Sulfur (Thousand Barrels) | ||||||||
| Year | Jan | Feb | Mar | Apr | May | Jun | Jul | Aug | Sep | Oct | Nov | Dec |
|---|---|---|---|---|---|---|---|---|---|---|---|---|
| 2006 | 506 | 636 | 866 | 1,079 | 979 | 988 | 896 | 1,077 | ||||
| 2007 | 850 | 841 | 1,025 | 1,091 | 1,109 | 1,046 | 1,062 | 1,008 | 1,122 | 1,110 | 1,223 | 1,171 |
| 2008 | 1,144 | 1,087 | 1,140 | 1,211 | 904 | 1,108 | 1,174 | 1,146 | 1,235 | 1,116 | 1,174 | 1,106 |
| 2009 | 814 | 447 | 1,073 | 1,208 | 1,153 | 1,167 | 1,159 | 1,153 | 1,163 | 1,167 | 1,199 | 1,094 |
| 2010 | 939 | 1,012 | 1,109 | 1,097 | 1,067 | 1,120 | 1,217 | 1,168 | 1,111 | 1,263 | 1,243 | 1,259 |
| 2011 | 1,128 | 705 | 1,129 | 985 | 1,067 | 1,269 | 1,242 | 1,293 | 1,332 | 1,403 | 1,321 | 1,174 |
| 2012 | 1,221 | 887 | 1,291 | 1,266 | 1,480 | 1,371 | 1,452 | 1,469 | 1,381 | 1,287 | 1,495 | 1,577 |
| 2013 | 893 | 704 | 1,546 | 1,500 | 1,578 | 1,483 | 1,479 | 1,584 | 1,506 | 1,283 | 1,055 | 1,057 |
| 2014 | 1,301 | 1,333 | 1,480 | 1,437 | 1,697 | 1,514 | 1,544 | 1,419 | 1,531 | 1,338 | 1,399 | 1,361 |
| 2015 | 951 | 1,290 | 1,731 | 1,506 | 1,719 | 1,614 | 1,696 | 1,587 | 1,704 | 1,719 | 1,573 | 1,485 |
| 2016 | 1,454 | 1,455 | 1,509 | 1,596 | 1,608 | 1,559 | 1,621 | 1,653 | 1,551 | 1,646 | 1,308 | 1,313 |
| 2017 | 1,711 | 1,166 | 711 | 1,262 | 1,881 | 1,884 | 1,847 | 1,817 | 1,798 | 1,901 | 1,690 | 1,731 |
| 2018 | 1,718 | 1,505 | 1,587 | 1,783 | 1,796 | 1,761 | 1,846 | 1,794 | 1,730 | 1,800 | 1,681 | 1,786 |
| 2019 | 1,602 | 1,457 | 1,681 | 1,771 | 1,761 | 1,481 | 1,634 | 1,712 | 1,572 | 978 | 1,378 | 1,307 |
| 2020 | 1,646 | 1,399 | 1,596 | 1,067 | 1,053 | 1,022 | 1,100 | 1,237 | 1,228 | 1,170 | 1,075 | 1,042 |
| 2021 | 1,240 | 1,135 | 1,409 | 1,233 | 1,570 | 1,263 | 1,433 | 1,269 | 1,156 | 210 | 733 | 1,026 |
| 2022 | 703 | 952 | 1,099 | 914 | 1,128 | 1,086 | 1,265 | 1,170 | 986 | 1,027 | 936 | 722 |
| 2023 | 652 | 814 | 548 | 349 | 910 | 781 | 910 | 1,029 | 1,033 | 1,071 | 1,043 | 884 |
| 2024 | 953 | |||||||||||
| - = No Data Reported; -- = Not Applicable; NA = Not Available; W = Withheld to avoid disclosure of individual company data. |
| Release Date: 3/29/2024 |
| Next Release Date: 4/30/2024 |