|
Download Data (XLS File) |
|
||||||||
|
||||||||
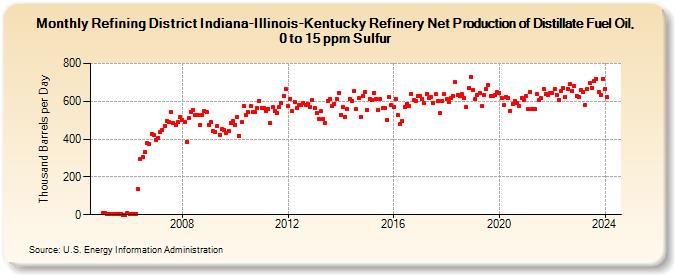
| Refining District Indiana-Illinois-Kentucky Refinery Net Production of Distillate Fuel Oil, 0 to 15 ppm Sulfur (Thousand Barrels per Day) | ||||||||
| Year | Jan | Feb | Mar | Apr | May | Jun | Jul | Aug | Sep | Oct | Nov | Dec |
|---|---|---|---|---|---|---|---|---|---|---|---|---|
| 2005 | 9 | 8 | 2 | 2 | 3 | 2 | 5 | 3 | 6 | 1 | 1 | 8 |
| 2006 | 6 | 3 | 6 | 6 | 137 | 293 | 303 | 332 | 378 | 376 | 428 | 421 |
| 2007 | 397 | 406 | 435 | 449 | 470 | 496 | 491 | 541 | 485 | 473 | 488 | 515 |
| 2008 | 503 | 489 | 383 | 512 | 545 | 554 | 525 | 525 | 476 | 529 | 550 | 544 |
| 2009 | 475 | 490 | 444 | 439 | 468 | 424 | 451 | 446 | 434 | 443 | 486 | 496 |
| 2010 | 477 | 515 | 418 | 489 | 573 | 525 | 542 | 574 | 541 | 544 | 566 | 601 |
| 2011 | 564 | 562 | 548 | 560 | 487 | 568 | 551 | 539 | 570 | 589 | 629 | 663 |
| 2012 | 575 | 613 | 547 | 598 | 566 | 578 | 578 | 591 | 581 | 586 | 569 | 608 |
| 2013 | 566 | 536 | 507 | 546 | 507 | 487 | 601 | 610 | 576 | 588 | 613 | 646 |
| 2014 | 530 | 571 | 519 | 558 | 614 | 604 | 653 | 558 | 616 | 518 | 628 | 651 |
| 2015 | 556 | 613 | 608 | 646 | 612 | 554 | 612 | 565 | 564 | 503 | 621 | 578 |
| 2016 | 569 | 612 | 525 | 478 | 496 | 569 | 588 | 577 | 638 | 607 | 600 | 628 |
| 2017 | 629 | 613 | 589 | 639 | 615 | 625 | 592 | 638 | 600 | 539 | 604 | 639 |
| 2018 | 612 | 596 | 618 | 630 | 702 | 634 | 626 | 636 | 619 | 568 | 670 | 729 |
| 2019 | 660 | 612 | 632 | 642 | 575 | 632 | 665 | 687 | 629 | 628 | 631 | 647 |
| 2020 | 645 | 617 | 580 | 625 | 620 | 551 | 584 | 604 | 592 | 573 | 620 | 609 |
| 2021 | 627 | 557 | 651 | 560 | 560 | 638 | 605 | 616 | 666 | 637 | 635 | 645 |
| 2022 | 645 | 664 | 634 | 609 | 652 | 670 | 621 | 666 | 691 | 656 | 681 | 630 |
| 2023 | 621 | 660 | 648 | 578 | 666 | 695 | 671 | 707 | 719 | 651 | 634 | 719 |
| 2024 | 667 | |||||||||||
| - = No Data Reported; -- = Not Applicable; NA = Not Available; W = Withheld to avoid disclosure of individual company data. |
| Release Date: 3/29/2024 |
| Next Release Date: 4/30/2024 |