|
Download Data (XLS File) |
|
||||||||
|
||||||||
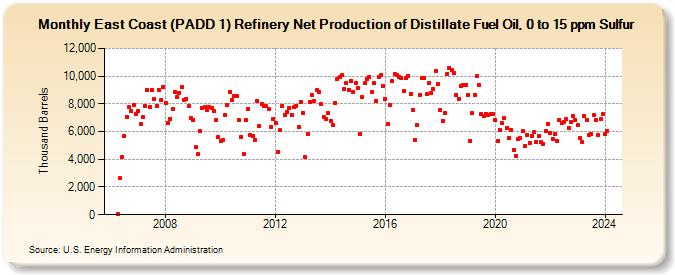
| East Coast (PADD 1) Refinery Net Production of Distillate Fuel Oil, 0 to 15 ppm Sulfur (Thousand Barrels) | ||||||||
| Year | Jan | Feb | Mar | Apr | May | Jun | Jul | Aug | Sep | Oct | Nov | Dec |
|---|---|---|---|---|---|---|---|---|---|---|---|---|
| 2006 | 31 | 2,643 | 4,130 | 5,687 | 7,080 | 7,748 | 7,450 | 7,948 | 7,234 | |||
| 2007 | 7,473 | 6,518 | 7,018 | 7,864 | 9,019 | 7,795 | 9,006 | 8,383 | 7,848 | 9,020 | 8,272 | 9,197 |
| 2008 | 8,049 | 6,611 | 6,896 | 7,609 | 8,818 | 8,471 | 8,776 | 9,222 | 8,255 | 8,318 | 7,862 | 6,954 |
| 2009 | 6,803 | 4,880 | 4,361 | 6,005 | 7,694 | 7,771 | 7,550 | 7,792 | 7,705 | 7,484 | 6,865 | 5,583 |
| 2010 | 5,305 | 5,368 | 7,173 | 7,881 | 8,825 | 8,270 | 8,562 | 8,530 | 6,825 | 5,608 | 4,348 | 6,851 |
| 2011 | 7,661 | 5,764 | 5,678 | 5,361 | 8,192 | 6,379 | 7,999 | 7,874 | 7,824 | 7,602 | 6,300 | 6,924 |
| 2012 | 6,649 | 4,540 | 6,091 | 7,857 | 7,207 | 7,399 | 7,707 | 7,206 | 7,753 | 7,867 | 6,327 | 8,105 |
| 2013 | 7,352 | 4,162 | 5,838 | 8,121 | 8,605 | 8,182 | 8,997 | 8,829 | 7,965 | 7,014 | 6,919 | 7,336 |
| 2014 | 6,773 | 6,445 | 8,082 | 9,765 | 9,962 | 10,057 | 9,099 | 9,523 | 9,029 | 9,682 | 8,862 | 9,511 |
| 2015 | 9,137 | 5,826 | 8,506 | 9,481 | 9,818 | 9,942 | 8,828 | 9,489 | 8,203 | 9,940 | 10,062 | 9,322 |
| 2016 | 8,361 | 6,525 | 7,938 | 9,616 | 10,149 | 10,068 | 9,961 | 9,878 | 8,954 | 9,842 | 10,015 | 8,734 |
| 2017 | 7,584 | 5,407 | 6,462 | 8,619 | 9,850 | 9,889 | 8,710 | 9,510 | 8,758 | 9,090 | 10,353 | 9,447 |
| 2018 | 7,572 | 6,749 | 7,310 | 10,145 | 10,617 | 10,422 | 10,221 | 8,659 | 8,356 | 9,271 | 9,345 | 9,351 |
| 2019 | 8,655 | 5,337 | 7,315 | 8,634 | 10,034 | 9,334 | 7,258 | 7,100 | 7,293 | 7,175 | 7,235 | 7,232 |
| 2020 | 6,816 | 5,311 | 6,134 | 6,586 | 6,982 | 6,248 | 5,546 | 6,123 | 4,701 | 4,260 | 5,448 | 5,570 |
| 2021 | 6,021 | 4,992 | 5,777 | 5,207 | 5,706 | 5,936 | 5,247 | 5,653 | 5,245 | 5,093 | 6,021 | 6,579 |
| 2022 | 5,923 | 5,484 | 5,801 | 5,329 | 6,850 | 6,622 | 6,718 | 6,870 | 6,269 | 6,667 | 7,149 | 6,814 |
| 2023 | 6,443 | 5,561 | 5,248 | 7,102 | 6,814 | 5,769 | 5,794 | 7,167 | 6,815 | 5,721 | 6,921 | 7,261 |
| 2024 | 5,819 | |||||||||||
| - = No Data Reported; -- = Not Applicable; NA = Not Available; W = Withheld to avoid disclosure of individual company data. |
| Release Date: 3/29/2024 |
| Next Release Date: 4/30/2024 |