|
Download Data (XLS File) |
|
||||||||
|
||||||||
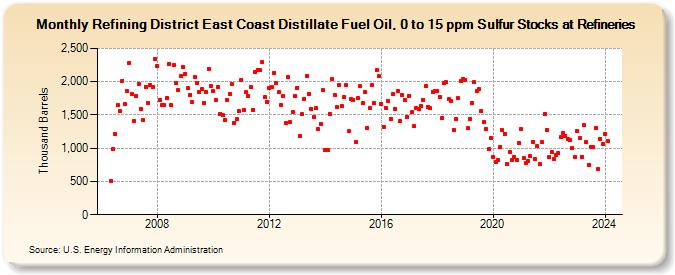
| Refining District East Coast Distillate Fuel Oil, 0 to 15 ppm Sulfur Stocks at Refineries (Thousand Barrels) | ||||||||
| Year | Jan | Feb | Mar | Apr | May | Jun | Jul | Aug | Sep | Oct | Nov | Dec |
|---|---|---|---|---|---|---|---|---|---|---|---|---|
| 2006 | 500 | 981 | 1,209 | 1,649 | 1,555 | 2,014 | 1,667 | 1,856 | ||||
| 2007 | 2,284 | 1,818 | 1,406 | 1,783 | 1,968 | 1,596 | 1,421 | 1,921 | 1,686 | 1,945 | 1,922 | 2,346 |
| 2008 | 2,235 | 1,725 | 1,647 | 1,642 | 1,751 | 2,271 | 1,647 | 2,253 | 1,977 | 1,874 | 2,088 | 2,219 |
| 2009 | 2,122 | 1,899 | 1,803 | 1,689 | 2,069 | 1,985 | 1,841 | 1,889 | 1,682 | 1,841 | 2,185 | 1,938 |
| 2010 | 1,854 | 1,723 | 1,915 | 1,512 | 1,499 | 1,419 | 1,718 | 1,811 | 1,971 | 1,386 | 1,433 | 1,558 |
| 2011 | 2,029 | 1,571 | 1,840 | 1,781 | 1,920 | 1,571 | 2,141 | 2,178 | 2,171 | 2,288 | 1,767 | 1,696 |
| 2012 | 1,903 | 1,915 | 2,137 | 1,985 | 1,838 | 1,646 | 1,782 | 1,386 | 2,072 | 1,391 | 1,546 | 1,787 |
| 2013 | 1,912 | 1,183 | 1,509 | 1,746 | 2,086 | 1,821 | 1,595 | 1,470 | 1,601 | 1,286 | 1,371 | 1,870 |
| 2014 | 968 | 972 | 1,514 | 2,038 | 1,792 | 1,614 | 1,943 | 1,639 | 1,768 | 1,951 | 1,251 | 1,743 |
| 2015 | 1,725 | 1,094 | 1,750 | 1,935 | 1,674 | 1,842 | 1,304 | 1,606 | 1,943 | 1,674 | 2,170 | 2,083 |
| 2016 | 1,671 | 1,323 | 1,606 | 1,702 | 1,441 | 1,810 | 1,596 | 1,856 | 1,412 | 1,804 | 1,726 | 1,476 |
| 2017 | 1,789 | 1,538 | 1,327 | 1,600 | 1,592 | 1,635 | 1,728 | 1,934 | 1,622 | 1,598 | 1,848 | 1,856 |
| 2018 | 1,864 | 1,769 | 1,448 | 1,974 | 1,988 | 1,732 | 1,713 | 1,278 | 1,440 | 1,748 | 2,006 | 2,046 |
| 2019 | 2,028 | 1,298 | 1,446 | 1,682 | 1,990 | 1,866 | 1,883 | 1,559 | 1,391 | 1,290 | 982 | 1,159 |
| 2020 | 870 | 792 | 819 | 1,023 | 1,269 | 1,220 | 765 | 945 | 826 | 870 | 824 | 1,083 |
| 2021 | 1,287 | 851 | 777 | 812 | 882 | 1,098 | 830 | 1,027 | 766 | 1,091 | 1,513 | 1,278 |
| 2022 | 866 | 937 | 831 | 903 | 924 | 1,161 | 1,232 | 1,187 | 1,145 | 1,124 | 1,009 | 867 |
| 2023 | 1,255 | 1,160 | 875 | 1,353 | 1,095 | 754 | 1,020 | 1,012 | 1,305 | 681 | 1,137 | 1,061 |
| 2024 | 1,215 | |||||||||||
| - = No Data Reported; -- = Not Applicable; NA = Not Available; W = Withheld to avoid disclosure of individual company data. |
| Release Date: 3/29/2024 |
| Next Release Date: 4/30/2024 |