|
Download Data (XLS File) |
|
||||||||
|
||||||||
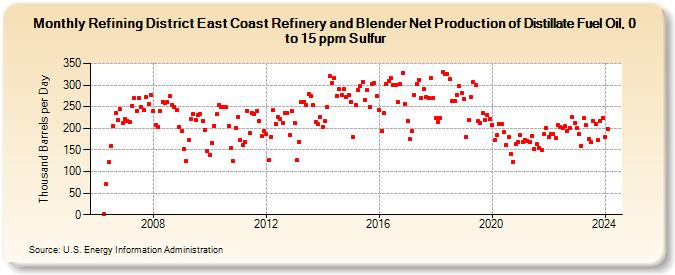
| Refining District East Coast Refinery and Blender Net Production of Distillate Fuel Oil, 0 to 15 ppm Sulfur (Thousand Barrels per Day) | ||||||||
| Year | Jan | Feb | Mar | Apr | May | Jun | Jul | Aug | Sep | Oct | Nov | Dec |
|---|---|---|---|---|---|---|---|---|---|---|---|---|
| 2006 | 1 | 70 | 121 | 160 | 206 | 236 | 220 | 244 | 213 | |||
| 2007 | 222 | 217 | 215 | 252 | 269 | 239 | 270 | 249 | 242 | 273 | 257 | 277 |
| 2008 | 240 | 208 | 204 | 239 | 262 | 259 | 260 | 274 | 254 | 250 | 243 | 203 |
| 2009 | 193 | 151 | 125 | 173 | 221 | 234 | 220 | 231 | 234 | 218 | 196 | 148 |
| 2010 | 138 | 165 | 206 | 232 | 254 | 250 | 250 | 249 | 206 | 154 | 124 | 200 |
| 2011 | 226 | 174 | 162 | 169 | 241 | 189 | 236 | 233 | 240 | 218 | 182 | 193 |
| 2012 | 187 | 127 | 180 | 242 | 210 | 225 | 222 | 212 | 236 | 235 | 185 | 240 |
| 2013 | 213 | 126 | 168 | 260 | 262 | 254 | 280 | 274 | 253 | 214 | 209 | 226 |
| 2014 | 202 | 216 | 250 | 321 | 305 | 316 | 275 | 290 | 278 | 290 | 272 | 277 |
| 2015 | 261 | 179 | 253 | 289 | 297 | 308 | 266 | 288 | 249 | 302 | 305 | 275 |
| 2016 | 243 | 194 | 235 | 302 | 309 | 317 | 300 | 300 | 261 | 302 | 329 | 256 |
| 2017 | 218 | 175 | 194 | 276 | 302 | 312 | 271 | 291 | 272 | 270 | 317 | 270 |
| 2018 | 224 | 215 | 224 | 330 | 325 | 326 | 314 | 263 | 263 | 278 | 298 | 282 |
| 2019 | 268 | 179 | 220 | 273 | 306 | 300 | 216 | 212 | 235 | 220 | 231 | 222 |
| 2020 | 208 | 172 | 184 | 211 | 210 | 191 | 161 | 180 | 140 | 122 | 164 | 168 |
| 2021 | 185 | 168 | 174 | 171 | 169 | 183 | 151 | 163 | 154 | 149 | 186 | 201 |
| 2022 | 181 | 187 | 186 | 178 | 207 | 203 | 201 | 205 | 193 | 200 | 226 | 212 |
| 2023 | 201 | 186 | 159 | 223 | 207 | 175 | 168 | 216 | 211 | 172 | 218 | 224 |
| 2024 | 180 | |||||||||||
| - = No Data Reported; -- = Not Applicable; NA = Not Available; W = Withheld to avoid disclosure of individual company data. |
| Release Date: 3/29/2024 |
| Next Release Date: 4/30/2024 |