|
Download Data (XLS File) |
|
||||||||
|
||||||||
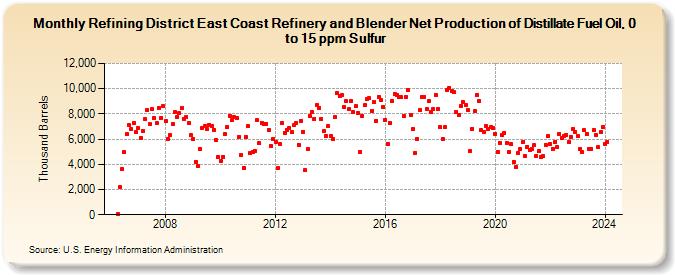
| Refining District East Coast Refinery and Blender Net Production of Distillate Fuel Oil, 0 to 15 ppm Sulfur (Thousand Barrels) | ||||||||
| Year | Jan | Feb | Mar | Apr | May | Jun | Jul | Aug | Sep | Oct | Nov | Dec |
|---|---|---|---|---|---|---|---|---|---|---|---|---|
| 2006 | 31 | 2,160 | 3,642 | 4,968 | 6,378 | 7,094 | 6,817 | 7,317 | 6,593 | |||
| 2007 | 6,868 | 6,079 | 6,679 | 7,573 | 8,343 | 7,164 | 8,359 | 7,709 | 7,267 | 8,456 | 7,705 | 8,598 |
| 2008 | 7,428 | 6,030 | 6,311 | 7,181 | 8,130 | 7,783 | 8,046 | 8,480 | 7,628 | 7,737 | 7,303 | 6,303 |
| 2009 | 5,998 | 4,219 | 3,879 | 5,186 | 6,864 | 7,033 | 6,814 | 7,149 | 7,005 | 6,747 | 5,892 | 4,600 |
| 2010 | 4,293 | 4,614 | 6,399 | 6,968 | 7,862 | 7,514 | 7,739 | 7,711 | 6,192 | 4,762 | 3,711 | 6,194 |
| 2011 | 7,011 | 4,862 | 5,012 | 5,070 | 7,477 | 5,668 | 7,317 | 7,220 | 7,202 | 6,743 | 5,464 | 5,994 |
| 2012 | 5,807 | 3,697 | 5,576 | 7,269 | 6,517 | 6,736 | 6,893 | 6,571 | 7,094 | 7,295 | 5,559 | 7,440 |
| 2013 | 6,599 | 3,514 | 5,194 | 7,795 | 8,113 | 7,629 | 8,667 | 8,493 | 7,603 | 6,619 | 6,266 | 7,011 |
| 2014 | 6,255 | 6,045 | 7,738 | 9,630 | 9,441 | 9,476 | 8,518 | 8,996 | 8,353 | 8,991 | 8,152 | 8,592 |
| 2015 | 8,101 | 5,005 | 7,834 | 8,682 | 9,195 | 9,228 | 8,258 | 8,934 | 7,458 | 9,359 | 9,141 | 8,536 |
| 2016 | 7,522 | 5,623 | 7,293 | 9,062 | 9,579 | 9,499 | 9,310 | 9,312 | 7,831 | 9,347 | 9,866 | 7,949 |
| 2017 | 6,764 | 4,902 | 6,011 | 8,278 | 9,364 | 9,348 | 8,406 | 9,006 | 8,156 | 8,385 | 9,515 | 8,369 |
| 2018 | 6,948 | 6,029 | 6,951 | 9,905 | 10,086 | 9,790 | 9,734 | 8,165 | 7,875 | 8,608 | 8,926 | 8,731 |
| 2019 | 8,314 | 5,017 | 6,826 | 8,204 | 9,497 | 9,014 | 6,696 | 6,575 | 7,037 | 6,814 | 6,925 | 6,888 |
| 2020 | 6,435 | 4,991 | 5,711 | 6,319 | 6,506 | 5,719 | 5,003 | 5,585 | 4,213 | 3,771 | 4,919 | 5,199 |
| 2021 | 5,731 | 4,697 | 5,379 | 5,138 | 5,241 | 5,500 | 4,676 | 5,054 | 4,611 | 4,628 | 5,568 | 6,239 |
| 2022 | 5,621 | 5,244 | 5,766 | 5,342 | 6,417 | 6,102 | 6,225 | 6,347 | 5,795 | 6,190 | 6,777 | 6,568 |
| 2023 | 6,245 | 5,207 | 4,937 | 6,693 | 6,406 | 5,250 | 5,220 | 6,707 | 6,335 | 5,336 | 6,533 | 6,954 |
| 2024 | 5,583 | |||||||||||
| - = No Data Reported; -- = Not Applicable; NA = Not Available; W = Withheld to avoid disclosure of individual company data. |
| Release Date: 3/29/2024 |
| Next Release Date: 4/30/2024 |