|
Download Data (XLS File) |
|
||||||||
|
||||||||
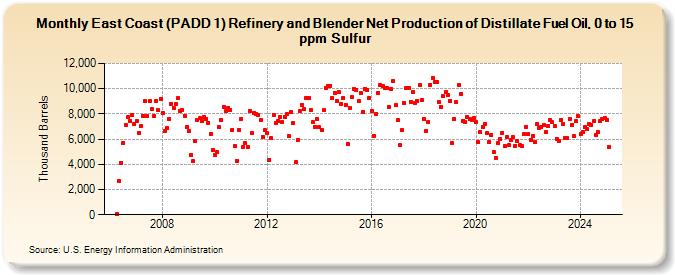
| East Coast (PADD 1) Refinery and Blender Net Production of Distillate Fuel Oil, 0 to 15 ppm Sulfur (Thousand Barrels) | ||||||||
| Year | Jan | Feb | Mar | Apr | May | Jun | Jul | Aug | Sep | Oct | Nov | Dec |
|---|---|---|---|---|---|---|---|---|---|---|---|---|
| 2006 | 31 | 2,643 | 4,130 | 5,687 | 7,080 | 7,748 | 7,450 | 7,948 | 7,234 | |||
| 2007 | 7,473 | 6,518 | 7,018 | 7,864 | 9,019 | 7,795 | 9,006 | 8,383 | 7,848 | 9,020 | 8,272 | 9,197 |
| 2008 | 8,049 | 6,611 | 6,896 | 7,609 | 8,818 | 8,471 | 8,776 | 9,222 | 8,255 | 8,318 | 7,862 | 6,954 |
| 2009 | 6,613 | 4,752 | 4,239 | 5,813 | 7,531 | 7,651 | 7,431 | 7,743 | 7,608 | 7,317 | 6,430 | 5,161 |
| 2010 | 4,745 | 4,954 | 6,930 | 7,487 | 8,537 | 8,222 | 8,463 | 8,330 | 6,748 | 5,427 | 4,295 | 6,752 |
| 2011 | 7,609 | 5,412 | 5,682 | 5,408 | 8,235 | 6,447 | 8,093 | 7,967 | 7,903 | 7,479 | 6,192 | 6,686 |
| 2012 | 6,462 | 4,370 | 6,048 | 7,921 | 7,315 | 7,473 | 7,715 | 7,346 | 7,789 | 7,957 | 6,239 | 8,139 |
| 2013 | 7,289 | 4,163 | 5,929 | 8,200 | 8,731 | 8,349 | 9,297 | 9,254 | 8,320 | 7,330 | 6,964 | 7,591 |
| 2014 | 6,922 | 6,711 | 8,270 | 10,052 | 10,180 | 10,243 | 9,236 | 9,660 | 9,041 | 9,724 | 8,808 | 9,270 |
| 2015 | 8,739 | 5,594 | 8,454 | 9,340 | 9,977 | 9,924 | 8,993 | 9,638 | 8,180 | 9,999 | 9,878 | 9,269 |
| 2016 | 8,209 | 6,249 | 8,026 | 9,696 | 10,310 | 10,239 | 10,057 | 10,048 | 8,586 | 10,000 | 10,590 | 8,695 |
| 2017 | 7,499 | 5,545 | 6,738 | 8,855 | 10,075 | 10,066 | 8,946 | 9,754 | 8,899 | 9,055 | 10,254 | 9,092 |
| 2018 | 7,628 | 6,664 | 7,369 | 10,293 | 10,871 | 10,528 | 10,506 | 8,935 | 8,571 | 9,395 | 9,705 | 9,533 |
| 2019 | 9,041 | 5,661 | 7,606 | 8,938 | 10,287 | 9,581 | 7,473 | 7,323 | 7,757 | 7,622 | 7,552 | 7,647 |
| 2020 | 7,318 | 5,766 | 6,539 | 6,970 | 7,235 | 6,494 | 5,779 | 6,326 | 4,949 | 4,530 | 5,662 | 5,982 |
| 2021 | 6,490 | 5,441 | 6,185 | 5,548 | 5,952 | 6,155 | 5,484 | 5,881 | 5,497 | 5,435 | 6,394 | 6,985 |
| 2022 | 6,409 | 5,955 | 6,279 | 5,740 | 7,177 | 6,892 | 6,949 | 7,114 | 6,543 | 7,017 | 7,541 | 7,330 |
| 2023 | 6,984 | 5,999 | 5,817 | 7,498 | 7,182 | 6,088 | 6,092 | 7,568 | 7,139 | 6,209 | 7,411 | 7,825 |
| 2024 | 6,412 | |||||||||||
| - = No Data Reported; -- = Not Applicable; NA = Not Available; W = Withheld to avoid disclosure of individual company data. |
| Release Date: 3/29/2024 |
| Next Release Date: 4/30/2024 |