|
Download Data (XLS File) |
|
||||||||
|
||||||||
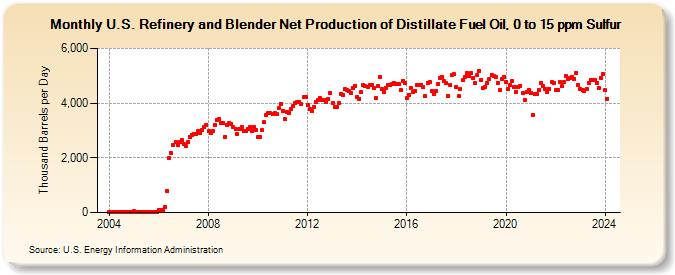
| U.S. Refinery and Blender Net Production of Distillate Fuel Oil, 0 to 15 ppm Sulfur (Thousand Barrels per Day) | ||||||||
| Year | Jan | Feb | Mar | Apr | May | Jun | Jul | Aug | Sep | Oct | Nov | Dec |
|---|---|---|---|---|---|---|---|---|---|---|---|---|
| 2004 | 30 | 13 | 8 | 13 | 26 | 14 | 15 | 14 | 24 | 16 | 29 | 36 |
| 2005 | 42 | 23 | 12 | 12 | 17 | 30 | 22 | 22 | 23 | 17 | 26 | 31 |
| 2006 | 96 | 82 | 101 | 209 | 796 | 1,979 | 2,171 | 2,454 | 2,584 | 2,465 | 2,595 | 2,634 |
| 2007 | 2,491 | 2,424 | 2,568 | 2,757 | 2,840 | 2,859 | 2,853 | 2,994 | 2,919 | 3,018 | 3,124 | 3,211 |
| 2008 | 2,971 | 2,910 | 2,964 | 3,196 | 3,378 | 3,413 | 3,270 | 3,282 | 2,760 | 3,200 | 3,266 | 3,241 |
| 2009 | 3,114 | 3,056 | 2,858 | 3,069 | 3,123 | 2,988 | 2,991 | 3,068 | 3,111 | 2,998 | 3,120 | 3,003 |
| 2010 | 2,748 | 2,755 | 3,003 | 3,307 | 3,565 | 3,627 | 3,624 | 3,593 | 3,625 | 3,597 | 3,804 | 3,968 |
| 2011 | 3,725 | 3,418 | 3,676 | 3,631 | 3,789 | 3,904 | 4,009 | 4,037 | 4,050 | 3,963 | 4,220 | 4,237 |
| 2012 | 3,925 | 3,771 | 3,715 | 3,873 | 4,040 | 4,131 | 4,185 | 4,097 | 4,128 | 4,025 | 4,166 | 4,374 |
| 2013 | 3,987 | 3,844 | 3,843 | 3,989 | 4,327 | 4,310 | 4,504 | 4,495 | 4,432 | 4,381 | 4,546 | 4,633 |
| 2014 | 4,218 | 4,167 | 4,392 | 4,658 | 4,633 | 4,573 | 4,668 | 4,674 | 4,557 | 4,197 | 4,620 | 4,957 |
| 2015 | 4,507 | 4,408 | 4,562 | 4,665 | 4,656 | 4,695 | 4,740 | 4,710 | 4,685 | 4,463 | 4,826 | 4,734 |
| 2016 | 4,171 | 4,299 | 4,558 | 4,390 | 4,449 | 4,667 | 4,666 | 4,672 | 4,571 | 4,257 | 4,746 | 4,767 |
| 2017 | 4,449 | 4,329 | 4,446 | 4,699 | 4,928 | 4,960 | 4,799 | 4,730 | 4,261 | 4,644 | 5,016 | 5,047 |
| 2018 | 4,603 | 4,247 | 4,499 | 4,836 | 4,945 | 5,089 | 4,978 | 5,101 | 4,924 | 4,719 | 5,018 | 5,190 |
| 2019 | 4,856 | 4,546 | 4,599 | 4,725 | 4,884 | 5,025 | 4,977 | 4,943 | 4,745 | 4,464 | 4,883 | 4,957 |
| 2020 | 4,785 | 4,523 | 4,667 | 4,802 | 4,600 | 4,398 | 4,601 | 4,628 | 4,366 | 4,105 | 4,403 | 4,493 |
| 2021 | 4,360 | 3,577 | 4,329 | 4,349 | 4,494 | 4,751 | 4,613 | 4,528 | 4,397 | 4,533 | 4,760 | 4,732 |
| 2022 | 4,465 | 4,488 | 4,771 | 4,618 | 4,766 | 4,983 | 4,885 | 4,929 | 4,954 | 4,886 | 5,115 | 4,658 |
| 2023 | 4,522 | 4,465 | 4,445 | 4,531 | 4,742 | 4,855 | 4,848 | 4,857 | 4,746 | 4,548 | 4,922 | 5,051 |
| 2024 | 4,461 | |||||||||||
| - = No Data Reported; -- = Not Applicable; NA = Not Available; W = Withheld to avoid disclosure of individual company data. |
| Release Date: 3/29/2024 |
| Next Release Date: 4/30/2024 |