|
Download Data (XLS File) |
|
||||||||
|
||||||||
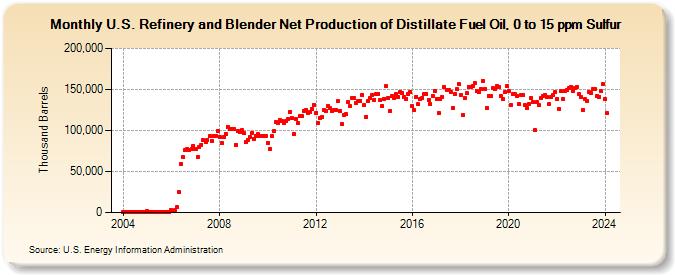
| U.S. Refinery and Blender Net Production of Distillate Fuel Oil, 0 to 15 ppm Sulfur (Thousand Barrels) | ||||||||
| Year | Jan | Feb | Mar | Apr | May | Jun | Jul | Aug | Sep | Oct | Nov | Dec |
|---|---|---|---|---|---|---|---|---|---|---|---|---|
| 2004 | 922 | 381 | 236 | 398 | 814 | 421 | 460 | 444 | 714 | 495 | 856 | 1,106 |
| 2005 | 1,299 | 657 | 385 | 371 | 538 | 889 | 670 | 685 | 677 | 535 | 785 | 965 |
| 2006 | 2,974 | 2,291 | 3,142 | 6,284 | 24,684 | 59,356 | 67,287 | 76,061 | 77,519 | 76,430 | 77,856 | 81,640 |
| 2007 | 77,214 | 67,879 | 79,619 | 82,705 | 88,047 | 85,766 | 88,436 | 92,815 | 87,567 | 93,566 | 93,719 | 99,540 |
| 2008 | 92,100 | 84,378 | 91,890 | 95,894 | 104,724 | 102,381 | 101,384 | 101,757 | 82,792 | 99,185 | 97,978 | 100,483 |
| 2009 | 96,536 | 85,566 | 88,594 | 92,057 | 96,800 | 89,625 | 92,707 | 95,098 | 93,344 | 92,923 | 93,595 | 93,081 |
| 2010 | 85,178 | 77,147 | 93,099 | 99,222 | 110,526 | 108,816 | 112,341 | 111,384 | 108,744 | 111,500 | 114,120 | 123,005 |
| 2011 | 115,488 | 95,703 | 113,944 | 108,922 | 117,474 | 117,115 | 124,284 | 125,136 | 121,501 | 122,845 | 126,597 | 131,341 |
| 2012 | 121,672 | 109,369 | 115,167 | 116,183 | 125,246 | 123,922 | 129,747 | 127,001 | 123,839 | 124,763 | 124,976 | 135,595 |
| 2013 | 123,607 | 107,621 | 119,145 | 119,678 | 134,136 | 129,307 | 139,639 | 139,359 | 132,950 | 135,823 | 136,390 | 143,616 |
| 2014 | 130,764 | 116,678 | 136,147 | 139,729 | 143,631 | 137,179 | 144,706 | 144,904 | 136,709 | 130,118 | 138,586 | 153,659 |
| 2015 | 139,715 | 123,437 | 141,423 | 139,936 | 144,337 | 140,845 | 146,947 | 146,025 | 140,558 | 138,347 | 144,765 | 146,751 |
| 2016 | 129,286 | 124,661 | 141,308 | 131,711 | 137,922 | 140,010 | 144,656 | 144,826 | 137,124 | 131,971 | 142,391 | 147,771 |
| 2017 | 137,924 | 121,203 | 137,833 | 140,974 | 152,760 | 148,800 | 148,780 | 146,620 | 127,840 | 143,956 | 150,491 | 156,471 |
| 2018 | 142,694 | 118,923 | 139,472 | 145,089 | 153,306 | 152,657 | 154,313 | 158,120 | 147,730 | 146,294 | 150,531 | 160,879 |
| 2019 | 150,549 | 127,296 | 142,555 | 141,758 | 151,405 | 150,748 | 154,280 | 153,234 | 142,346 | 138,391 | 146,502 | 153,676 |
| 2020 | 148,328 | 131,160 | 144,672 | 144,049 | 142,607 | 131,925 | 142,632 | 143,456 | 130,972 | 127,241 | 132,086 | 139,271 |
| 2021 | 135,157 | 100,167 | 134,198 | 130,456 | 139,305 | 142,536 | 143,008 | 140,354 | 131,899 | 140,527 | 142,792 | 146,694 |
| 2022 | 138,419 | 125,655 | 147,904 | 138,526 | 147,755 | 149,499 | 151,439 | 152,801 | 148,627 | 151,473 | 153,438 | 144,390 |
| 2023 | 140,197 | 125,018 | 137,788 | 135,940 | 147,007 | 145,650 | 150,287 | 150,579 | 142,366 | 140,990 | 147,648 | 156,576 |
| 2024 | 138,285 | |||||||||||
| - = No Data Reported; -- = Not Applicable; NA = Not Available; W = Withheld to avoid disclosure of individual company data. |
| Release Date: 3/29/2024 |
| Next Release Date: 4/30/2024 |